Positioning
Use Logister when production problems need a visible workflow.
The product is organized around the work a team does after an app starts sending signals: scan the dashboard, open the project, choose an issue, assign or close it, and use the detail tabs to understand what happened. The same project screen also holds setup, notifications, team access, and cleanup controls so the day-to-day workflow stays close to the monitored app.
| When you are trying to... | Use Logister to... |
|---|---|
| Turn repeated errors into owned work | Open a grouped error, assign an owner, choose a status, and keep occurrence history attached to the issue. |
| Understand whether one app or all apps need attention | Use the Overview dashboard for cross-app signals, then open the project view for focused charts, inbox state, and recent activity. |
| Explain a failure to a teammate | Use the event detail tabs for request context, stacktrace, occurrences, and related logs instead of copying fragments out of separate tools. |
Connect services
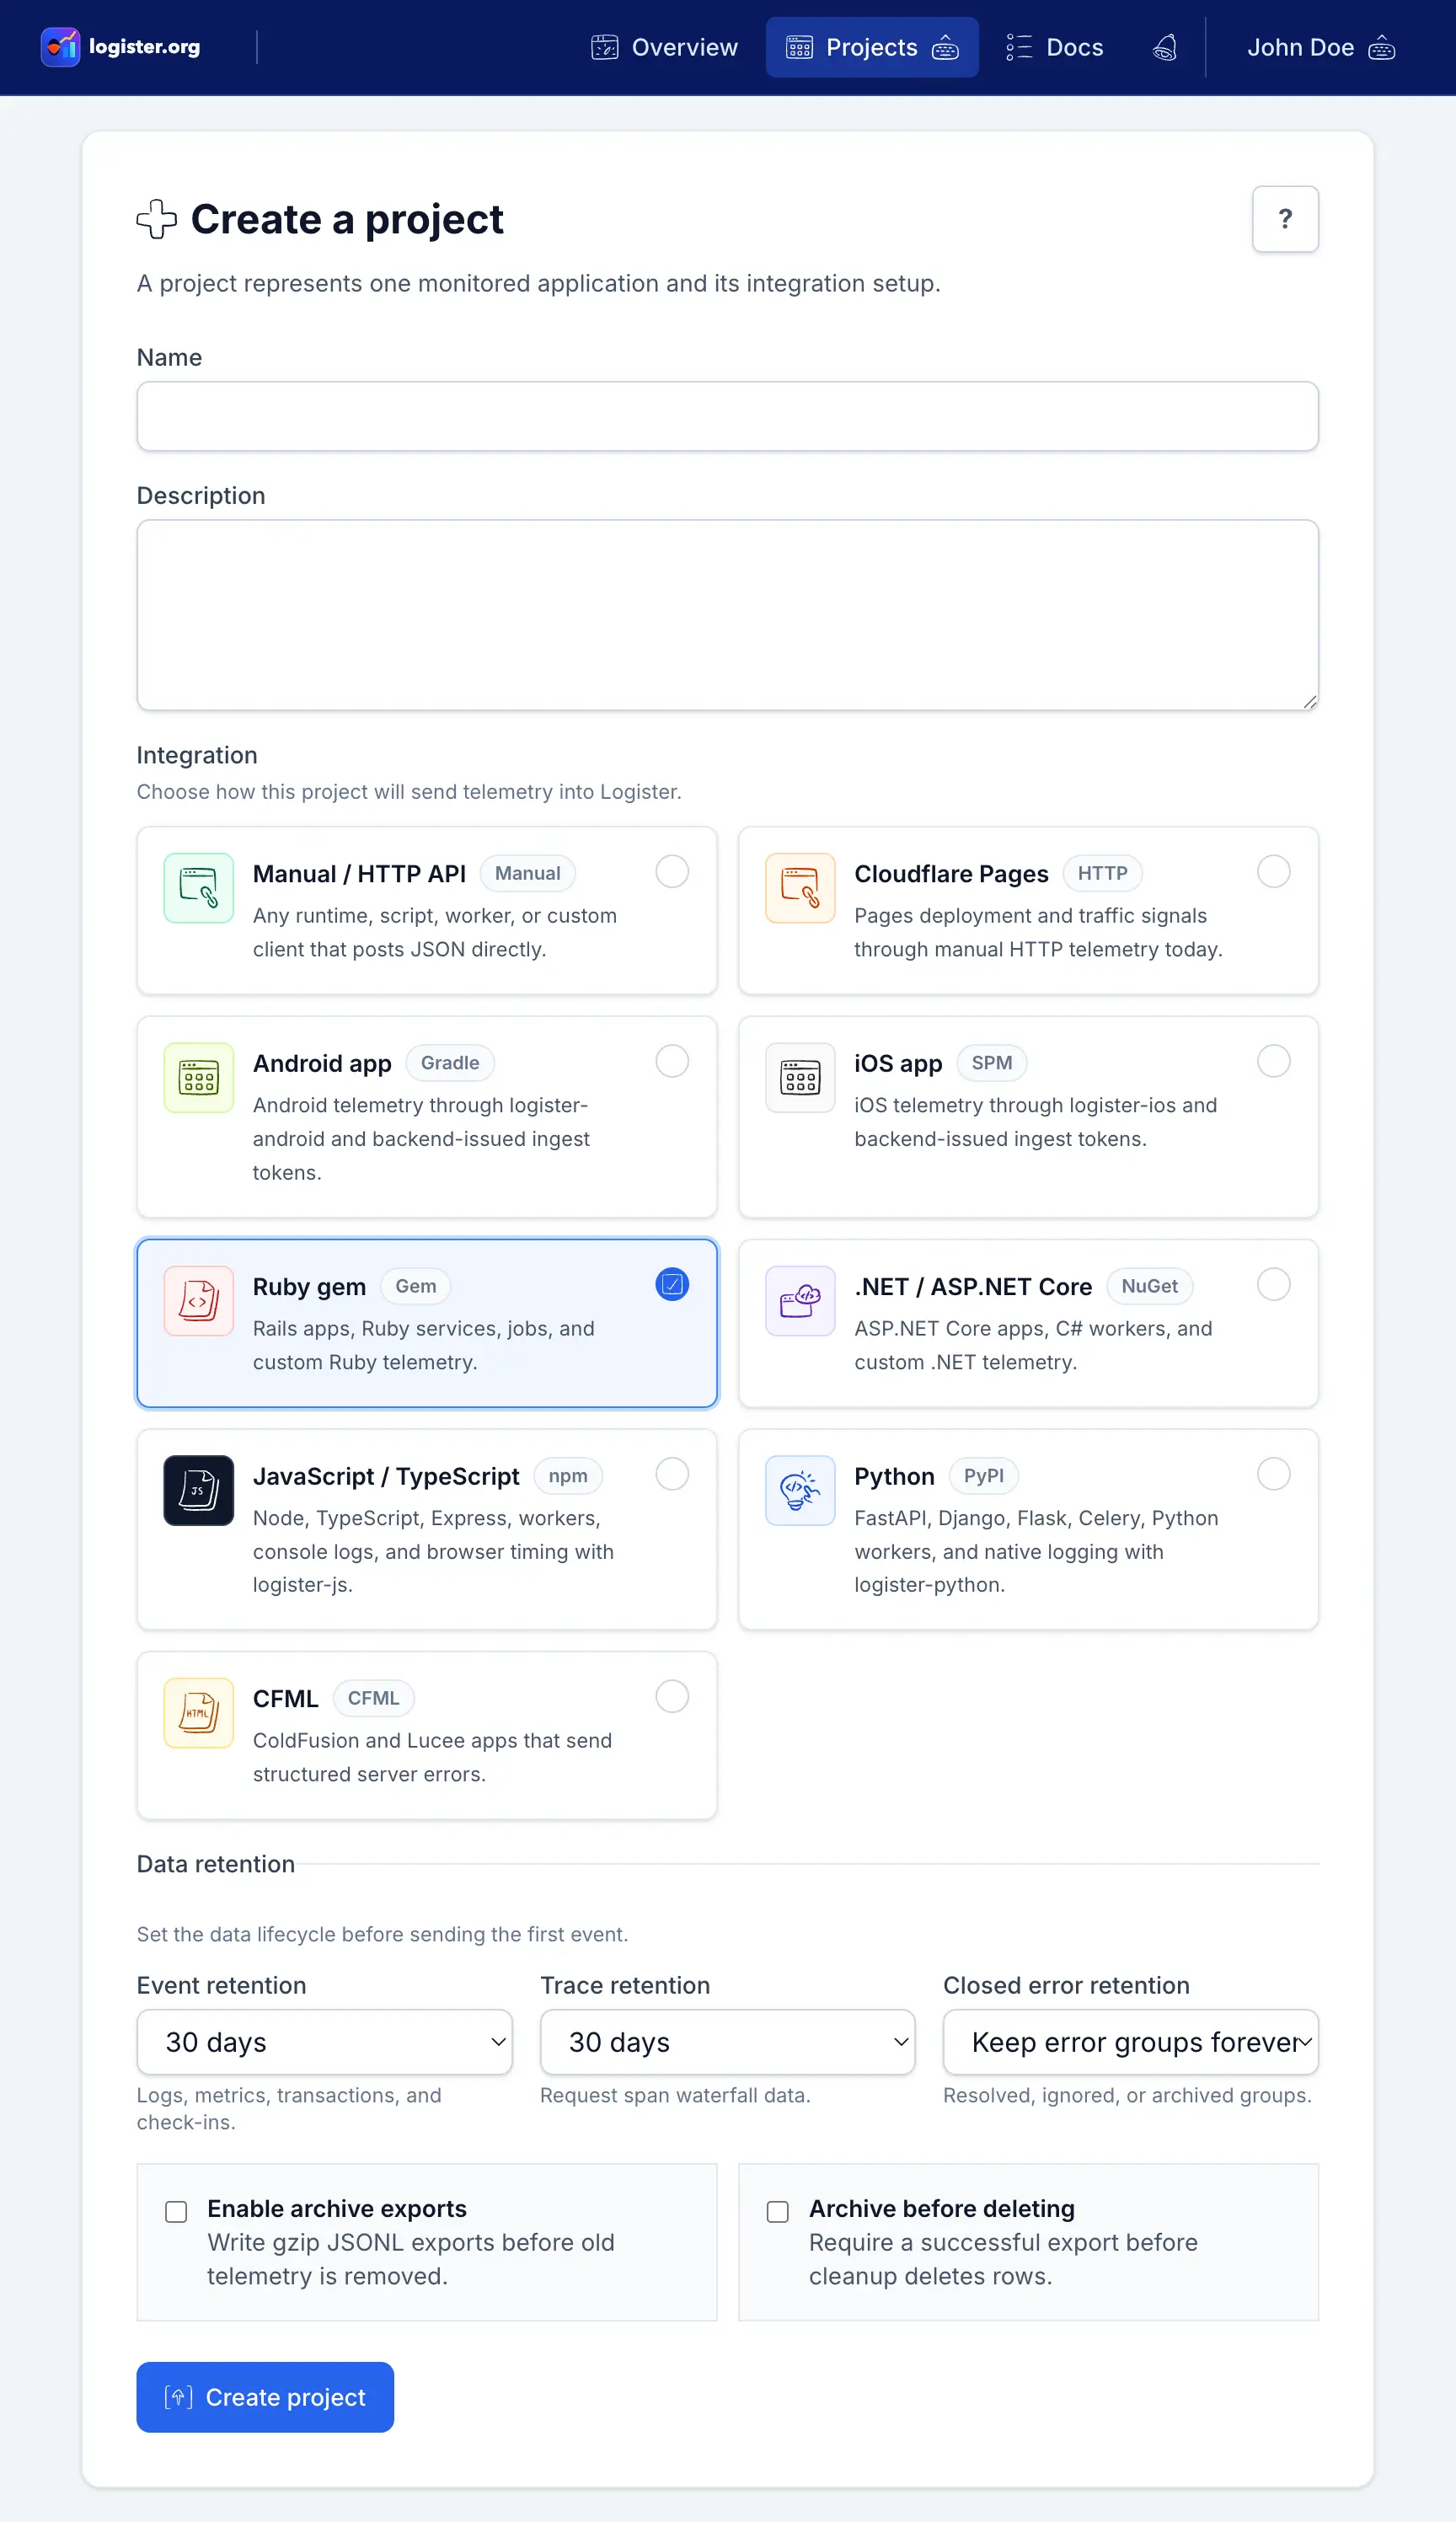
Start each monitored app as a project.
A project is the workspace for one app or service. It keeps API keys, events, settings, notifications, team access, and retention choices scoped to that app.
When you create a project, pick the integration type that will send the first event. The Setup tab then shows package, API key, and verification steps for that runtime.
Project path
Move from setup to review without leaving the app context.
- ConnectCreate the project, choose the runtime, and generate the first API key.
- ReviewOpen the dashboard card when recent activity or open errors need a closer look.
- RetireArchive quiet apps when you want history without keeping them in active lists.
| You want to... | Use the UI to... |
|---|---|
| Connect a new app | Create a project, choose the app type, then open the Setup tab for package and key instructions. |
| Find the next app to review | Sort visually by open errors, latest event, events over seven days, or quiet-project status. |
| Keep access scoped | Manage keys and teammates inside that project instead of sharing one global setup across every app. |
| Retire an app without losing context | Archive the project so it leaves active views but remains available when you need history. |
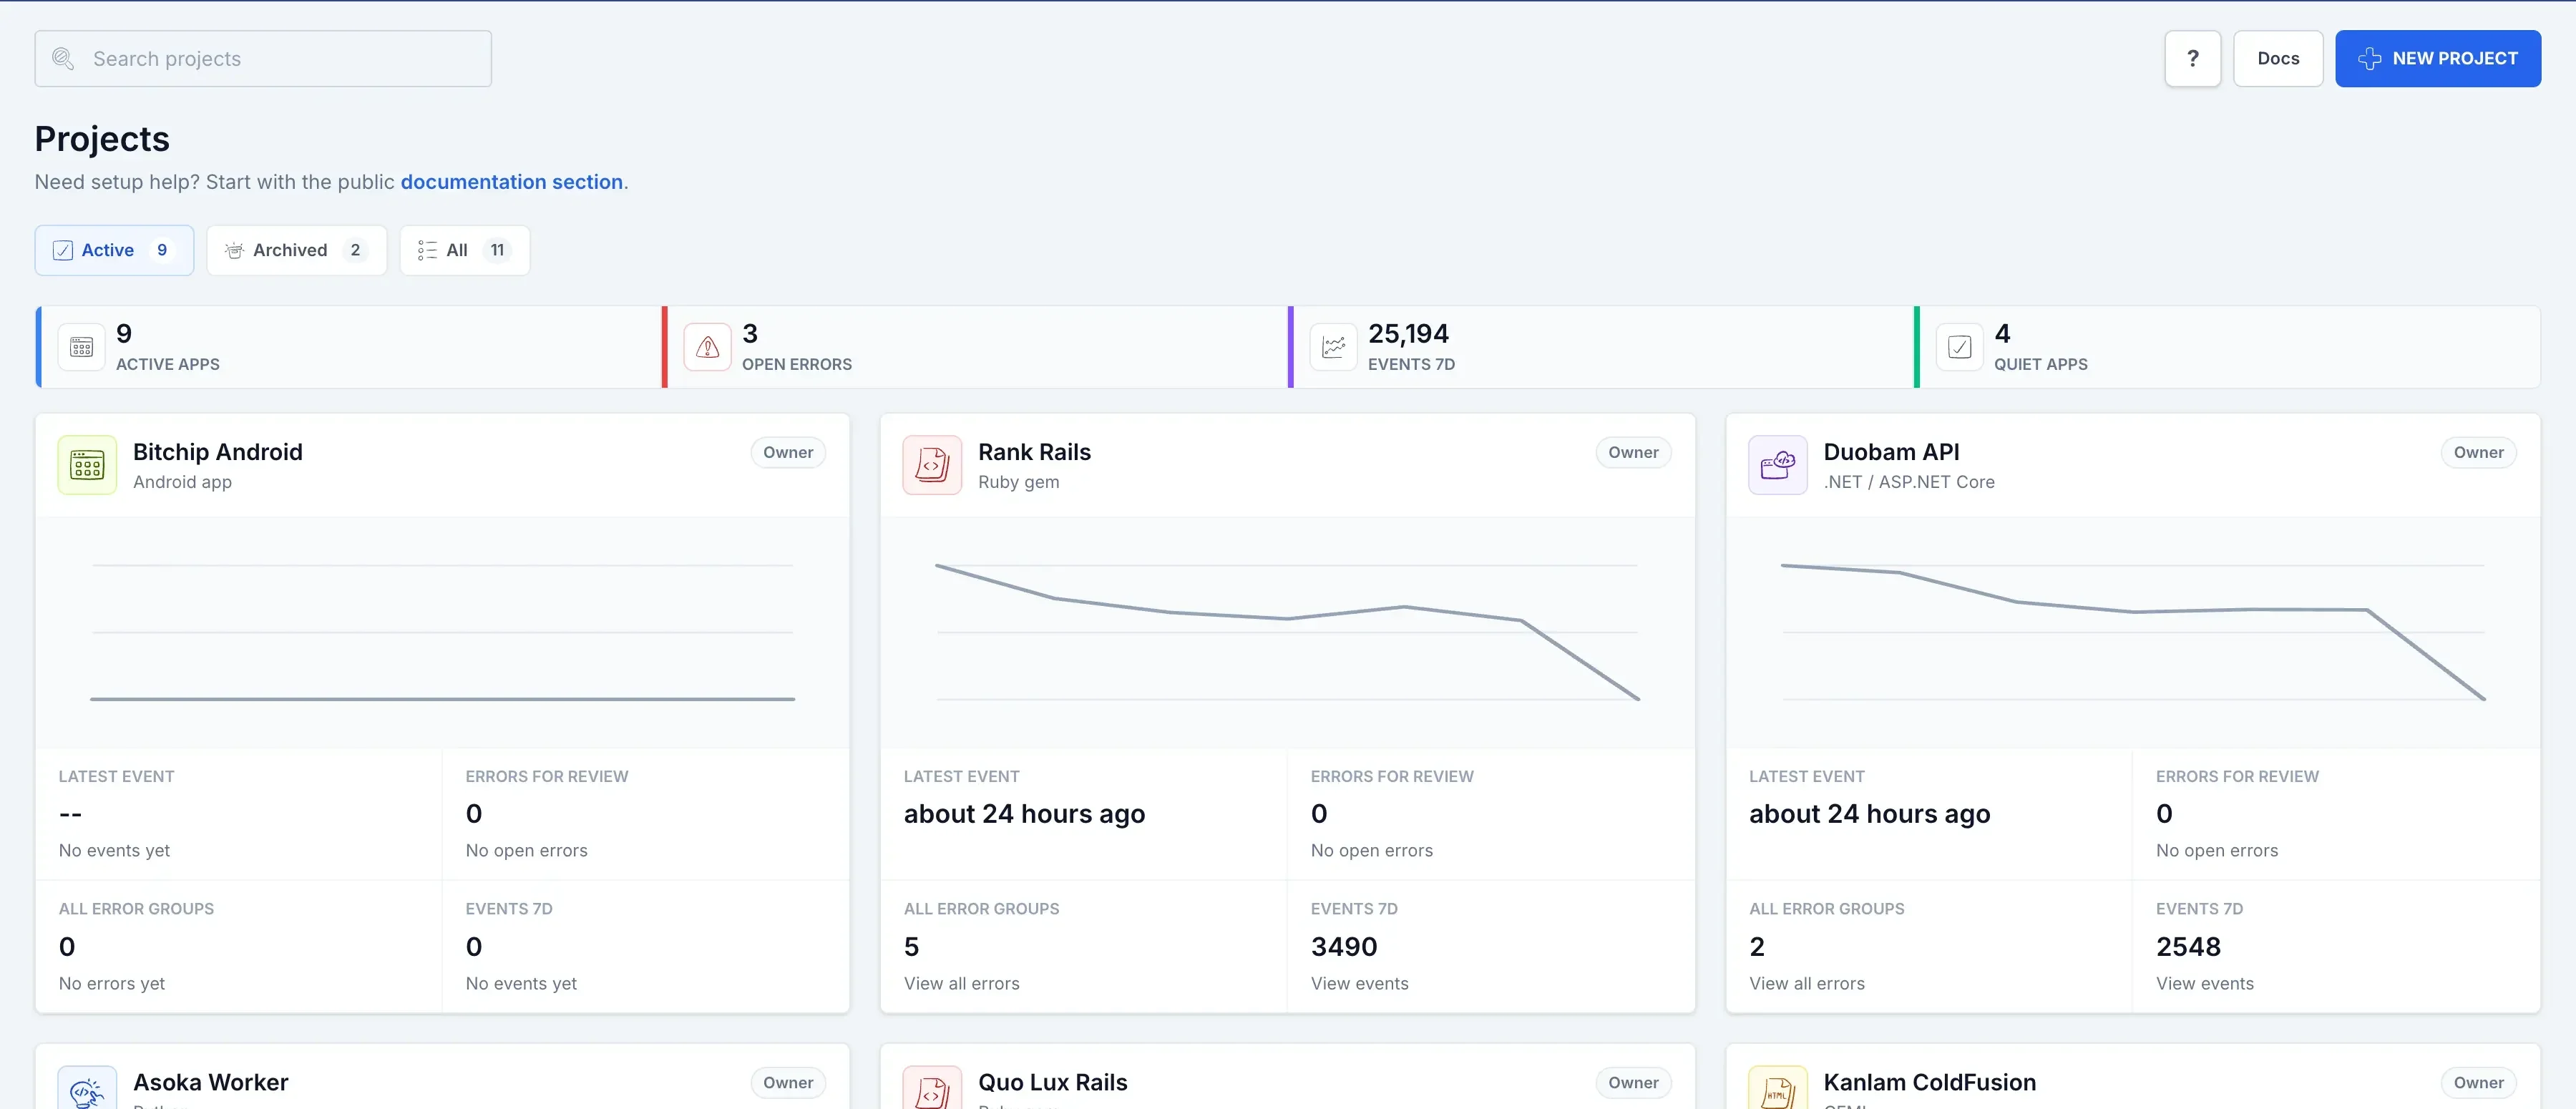
Dashboard overview
Use the dashboard for cross-app signal before opening a project.
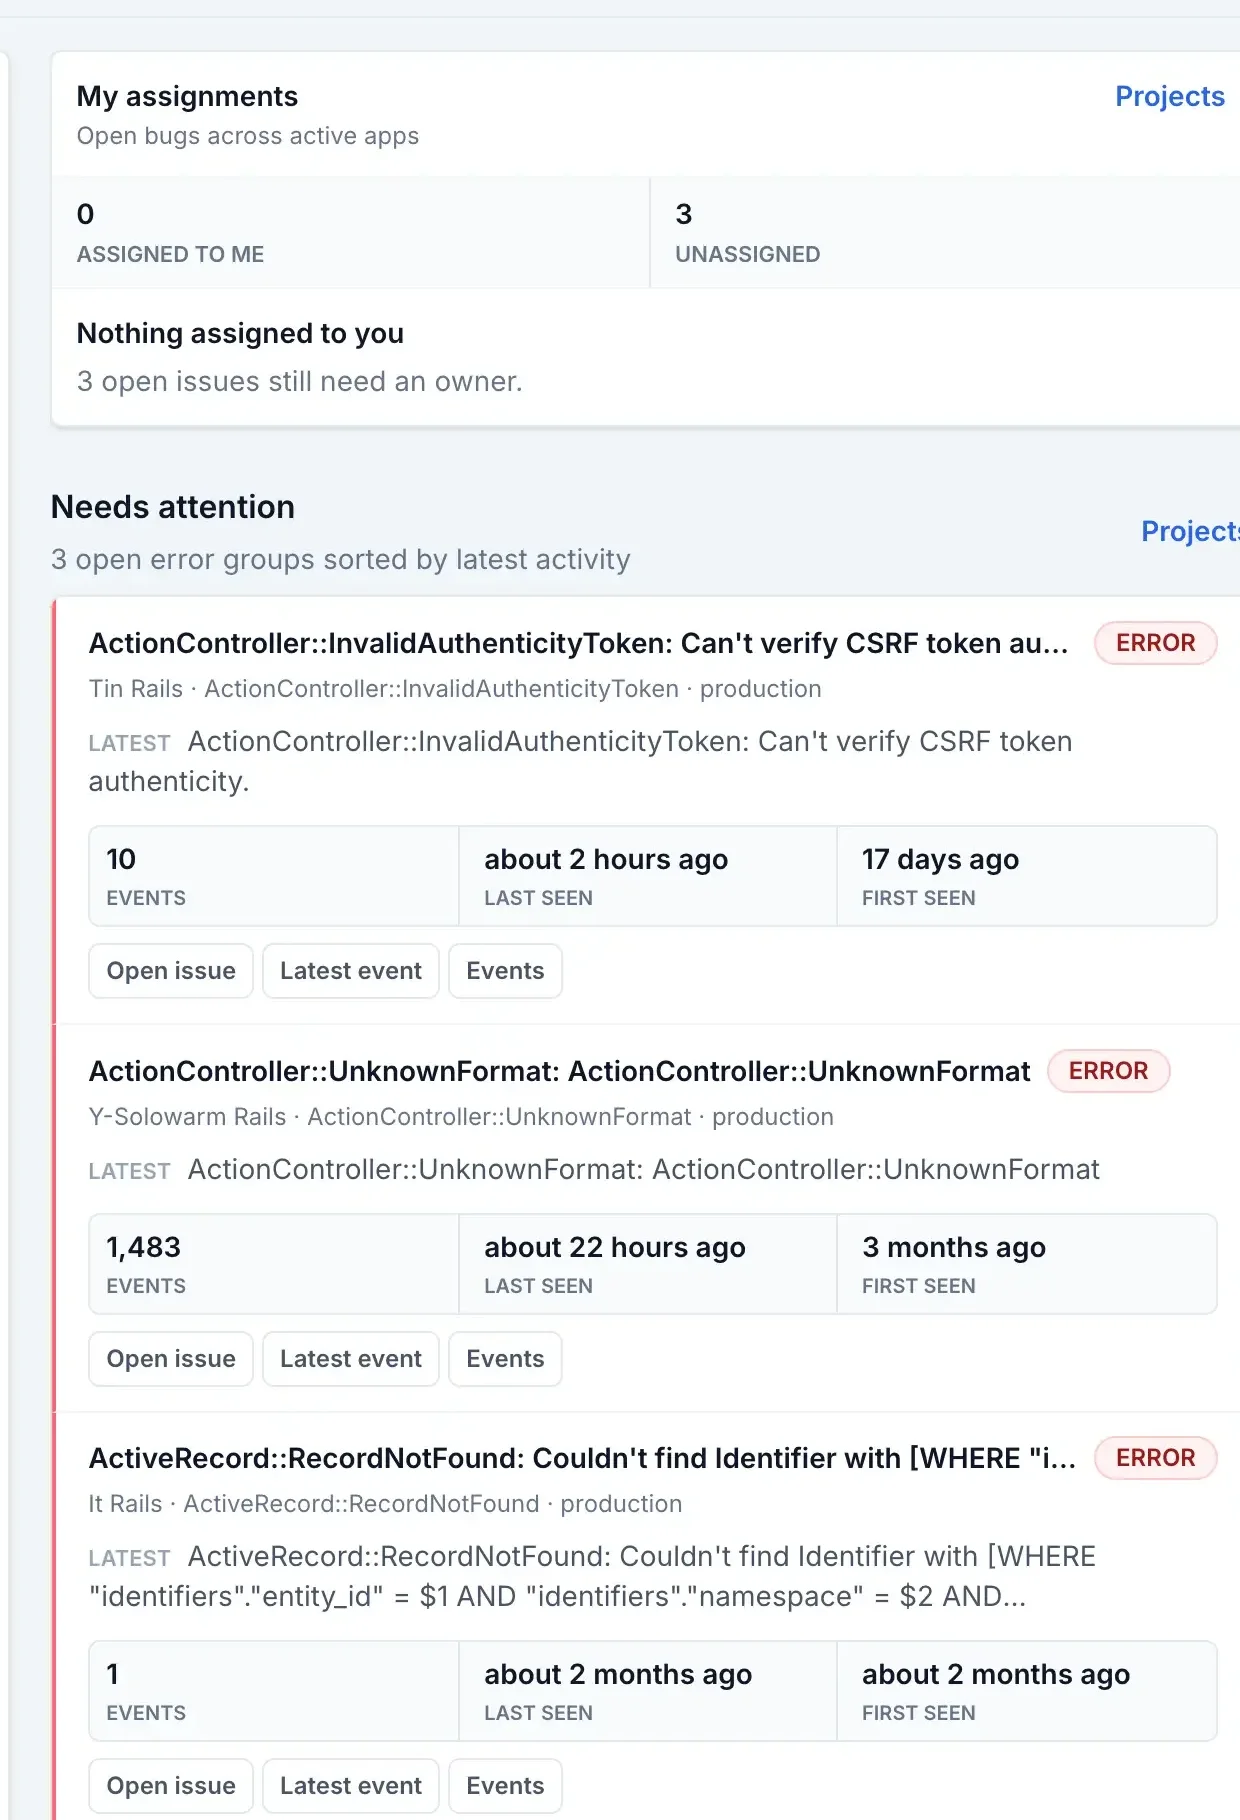
The dashboard has two jobs. Overview is for today's cross-app work: the big chart shows overall activity, My assignments shows work owned by you, and Needs attention highlights open issues that should not be buried in project cards. Projects is for scanning app health one project at a time.
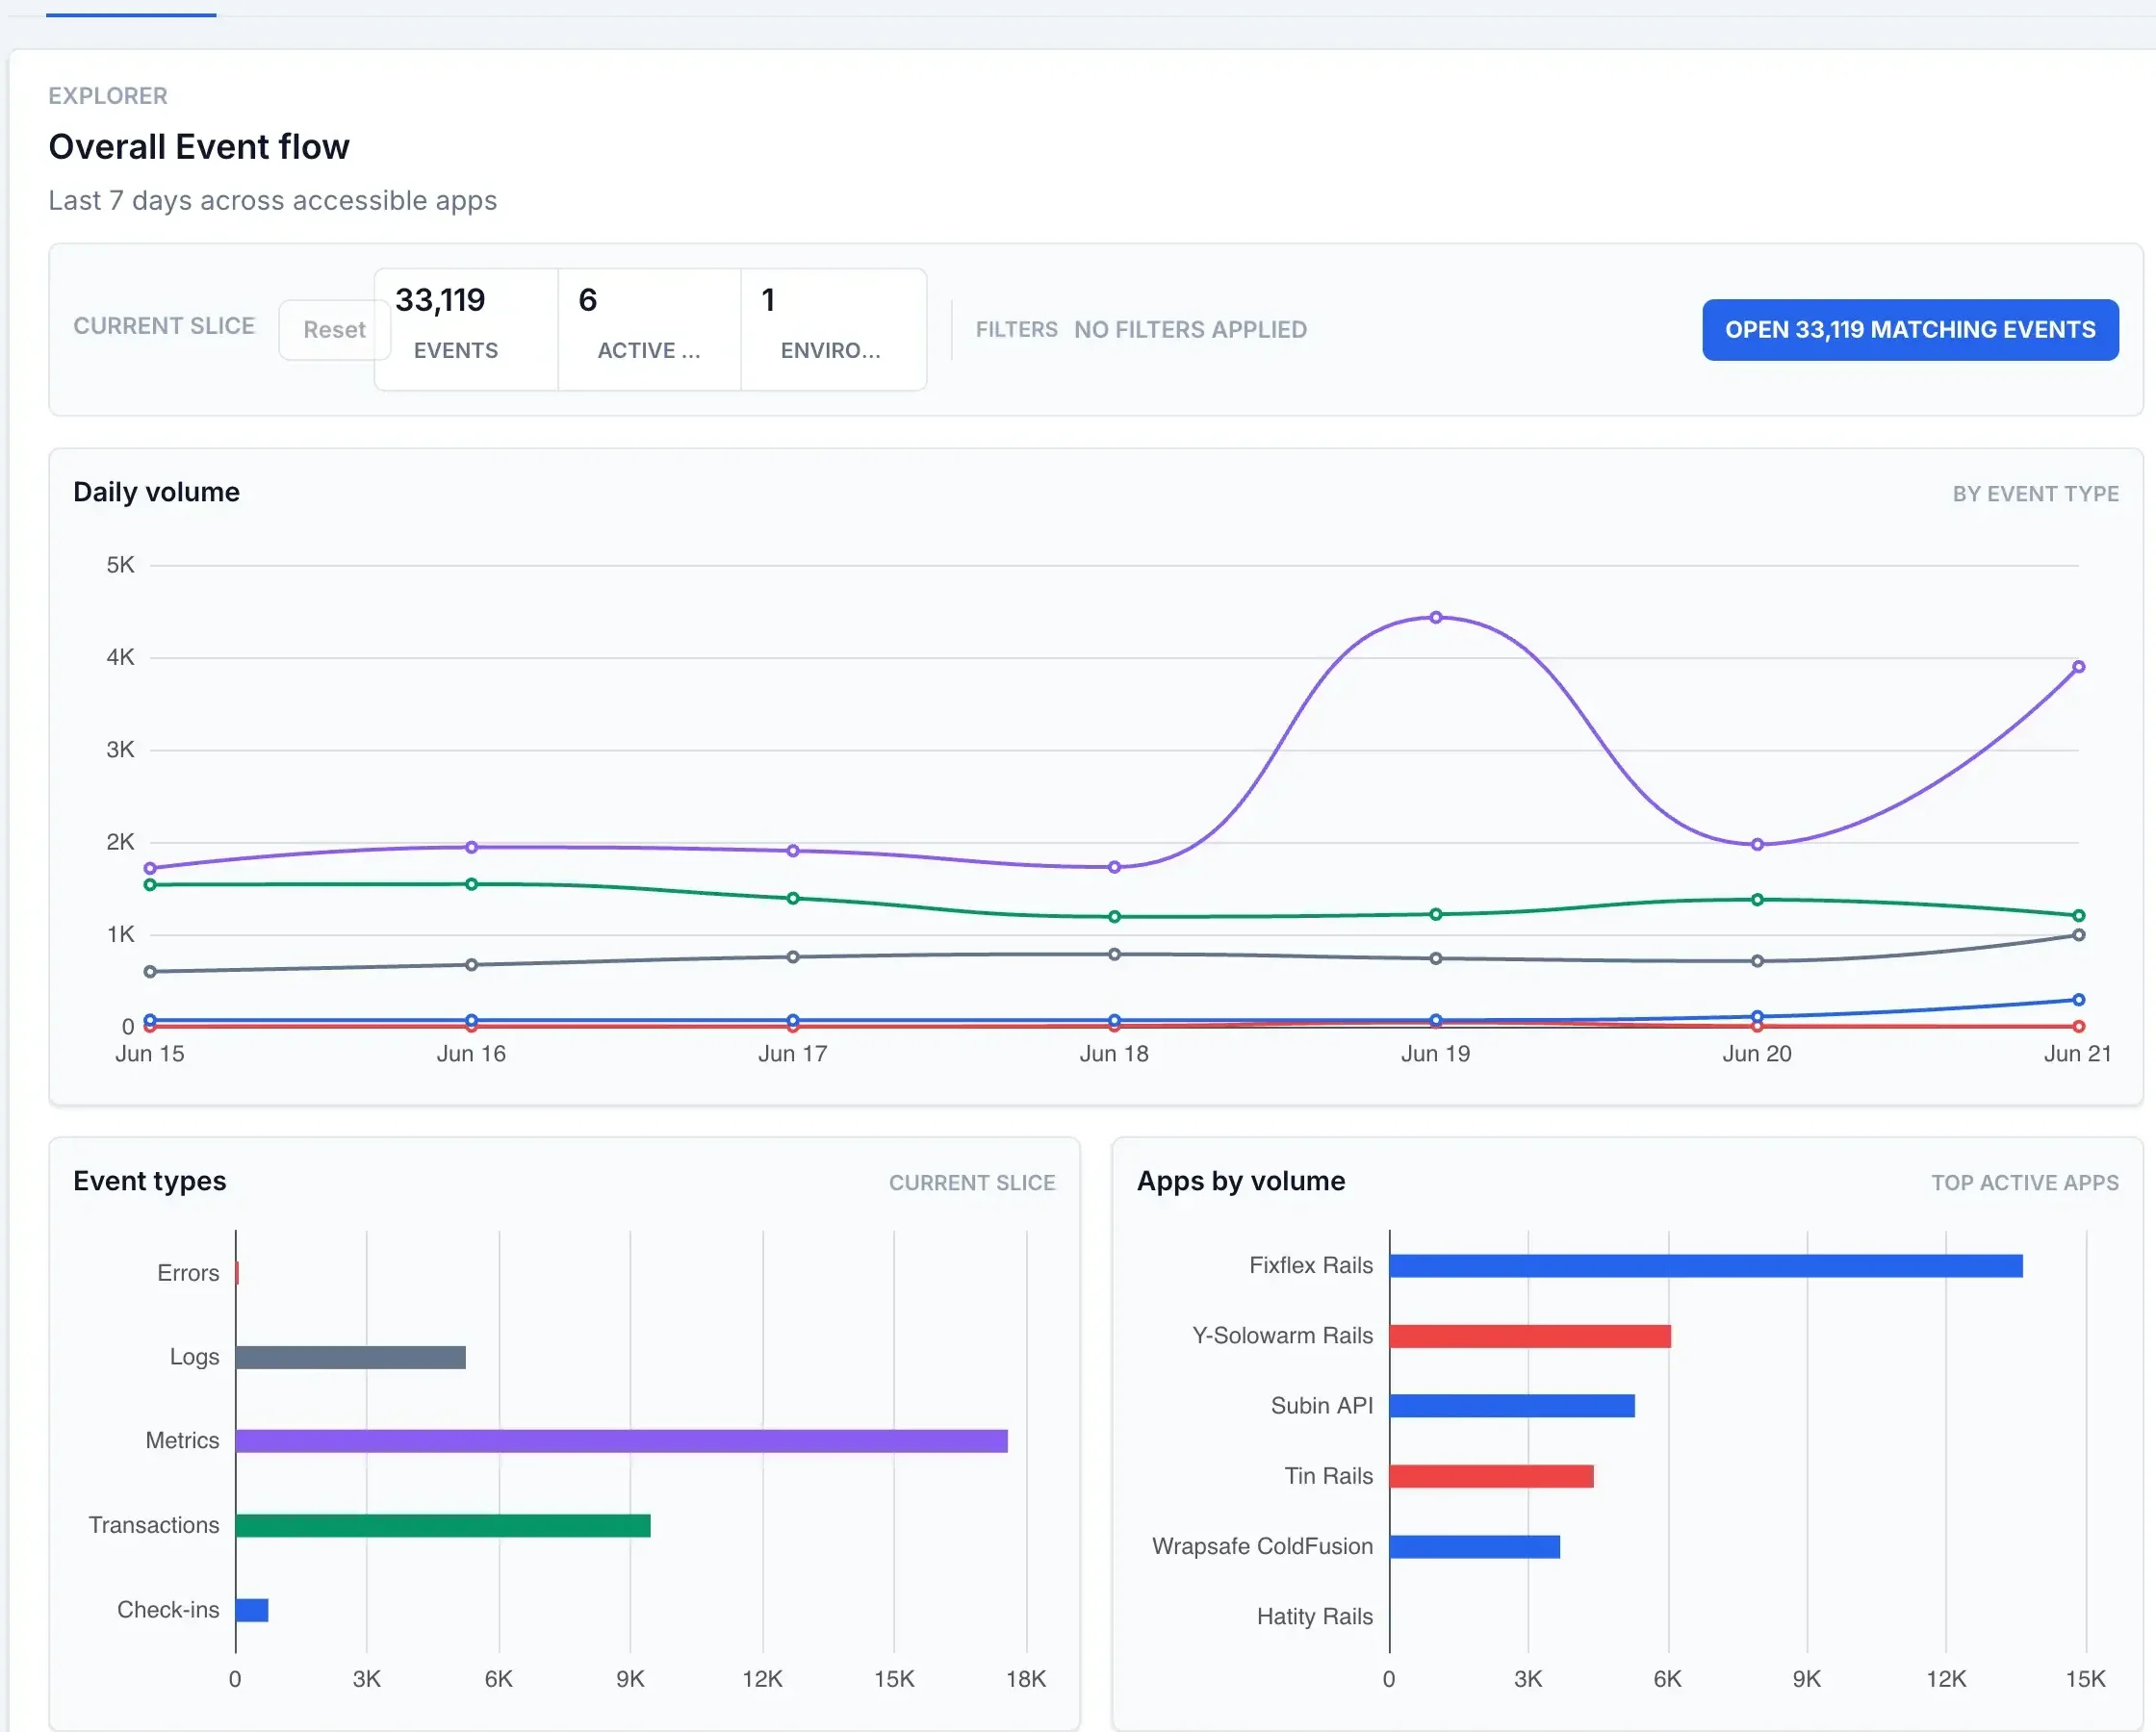
- Use Explorer when you want to know whether the whole account is getting noisier, quieter, or changing shape by event type.
- Use My assignments when you already own errors and need to get back to them quickly.
- Use Needs attention when you want a short list of open problems sorted by recent activity.
- Switch to Projects when you want to compare apps rather than investigate one chart.
Dashboard rhythm
Start broad, then open the smallest useful view.
- AccountUse Explorer to spot volume and shape changes across every app.
- OwnershipUse My assignments when the next action already belongs to you.
- QueueUse Needs attention when the team has not claimed the newest open work.
Insights
Use the project Insights tab to build a live view from Inbox, Activity, and Performance signals.
Insights is the project screen for answering, "what is happening here right now?" Use the lens buttons at the top to switch between event quality, errors and logs, performance, monitors, and custom app metrics. Then narrow the view with time range, environment, release, and attribute filters before opening the recent stream.
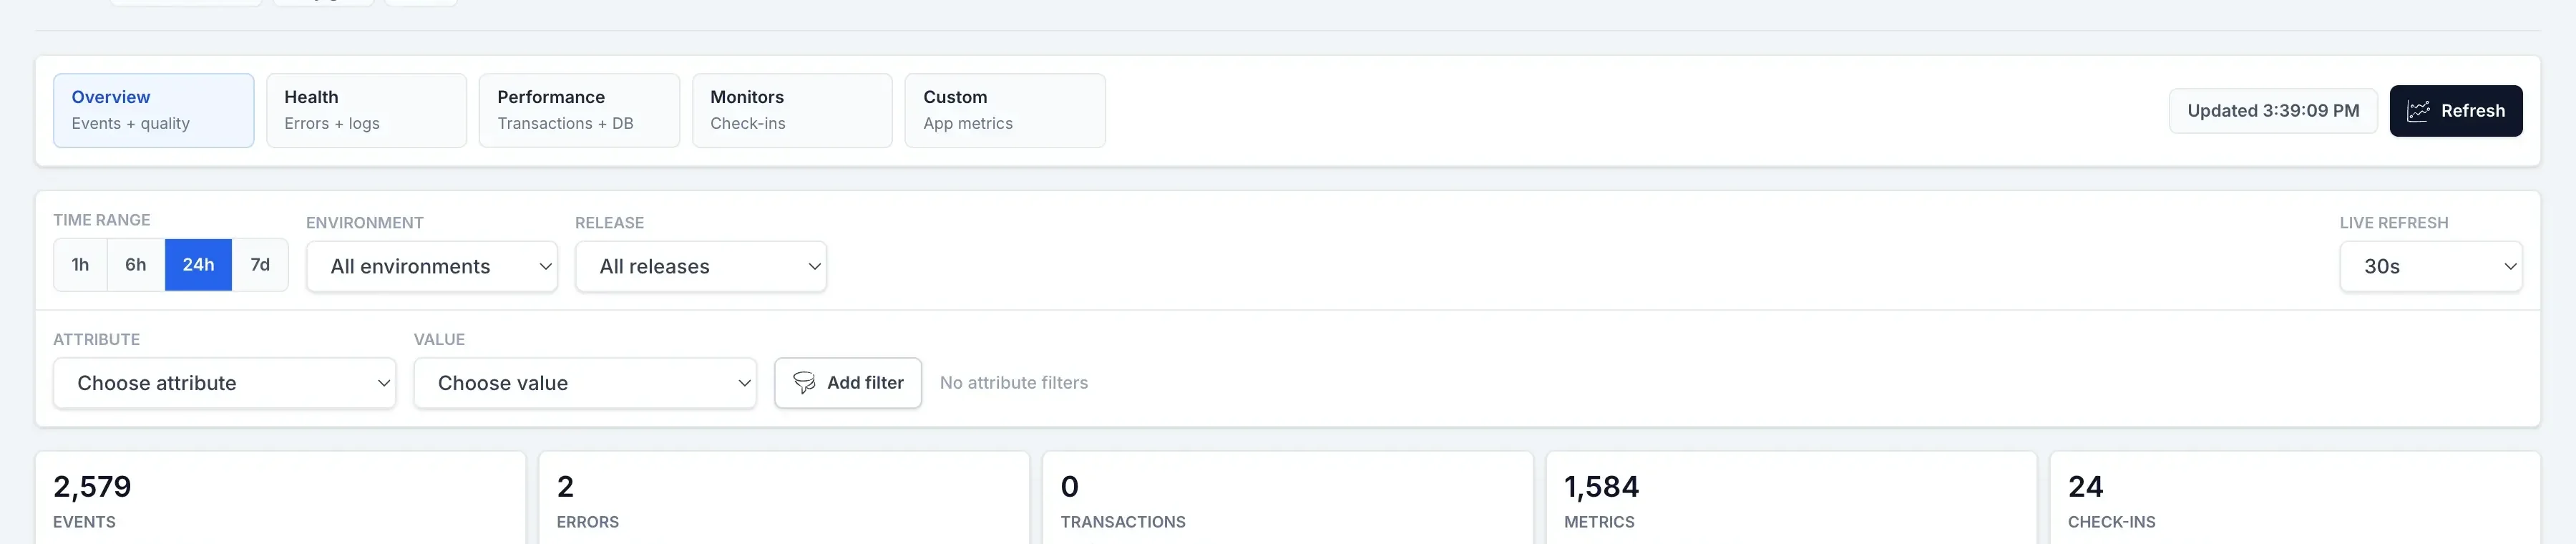
| Control | Best use |
|---|---|
| Time window | Start with 24h for a balanced view, use 1h while debugging a deploy or incident, and use 7d to spot slow trends. |
| Environment and release filters | Compare production against staging, or isolate one deploy when validating whether a release changed error volume, throughput, or latency. |
| Custom attribute filters | Filter by stable top-level event context such as service, region, queue, tenant tier, job name, route, or feature flag. Keep values low-cardinality so the filter list stays useful. |
| Metric catalog | Add or remove collected series such as total events, errors, transactions, P95 duration, database query timing, and custom metric names. |
| Live refresh | Use short refresh intervals during active debugging and longer intervals during passive monitoring to reduce unnecessary query load. |
| Recent stream | Open the newest matching events after narrowing the chart by time, environment, release, or custom attributes. |
Good dashboard recipes
- Release validation: filter to the new release, add total events, errors, transaction P95, and database query average, then compare the last hour with the previous day.
- Instrumentation audit: use the metric catalog, recent stream, and performance page to confirm logs, custom metrics, transactions, spans, and check-ins are arriving from the expected service or environment.
- Performance triage: add transaction P95, database query P95, request load spans, and error count so slowdowns and new failures share one timeline.
- Operational monitoring: filter by job or queue attributes and add custom metric series such as queue depth, processed jobs, retry count, or worker latency.
Why some filters or charts may look empty
Insights can only filter and chart values that your app sends consistently. If environment or release menus are empty, the incoming events probably do not include those labels yet.
- Use stable values such as
service,region,queue,route, ortenant_tier. - Avoid raw IDs, emails, full URLs, and request bodies as chart dimensions.
- Keep custom metric names stable and send a numeric value when you want a value chart instead of just a count.
- Use faster live refresh only while actively watching a deploy or incident.
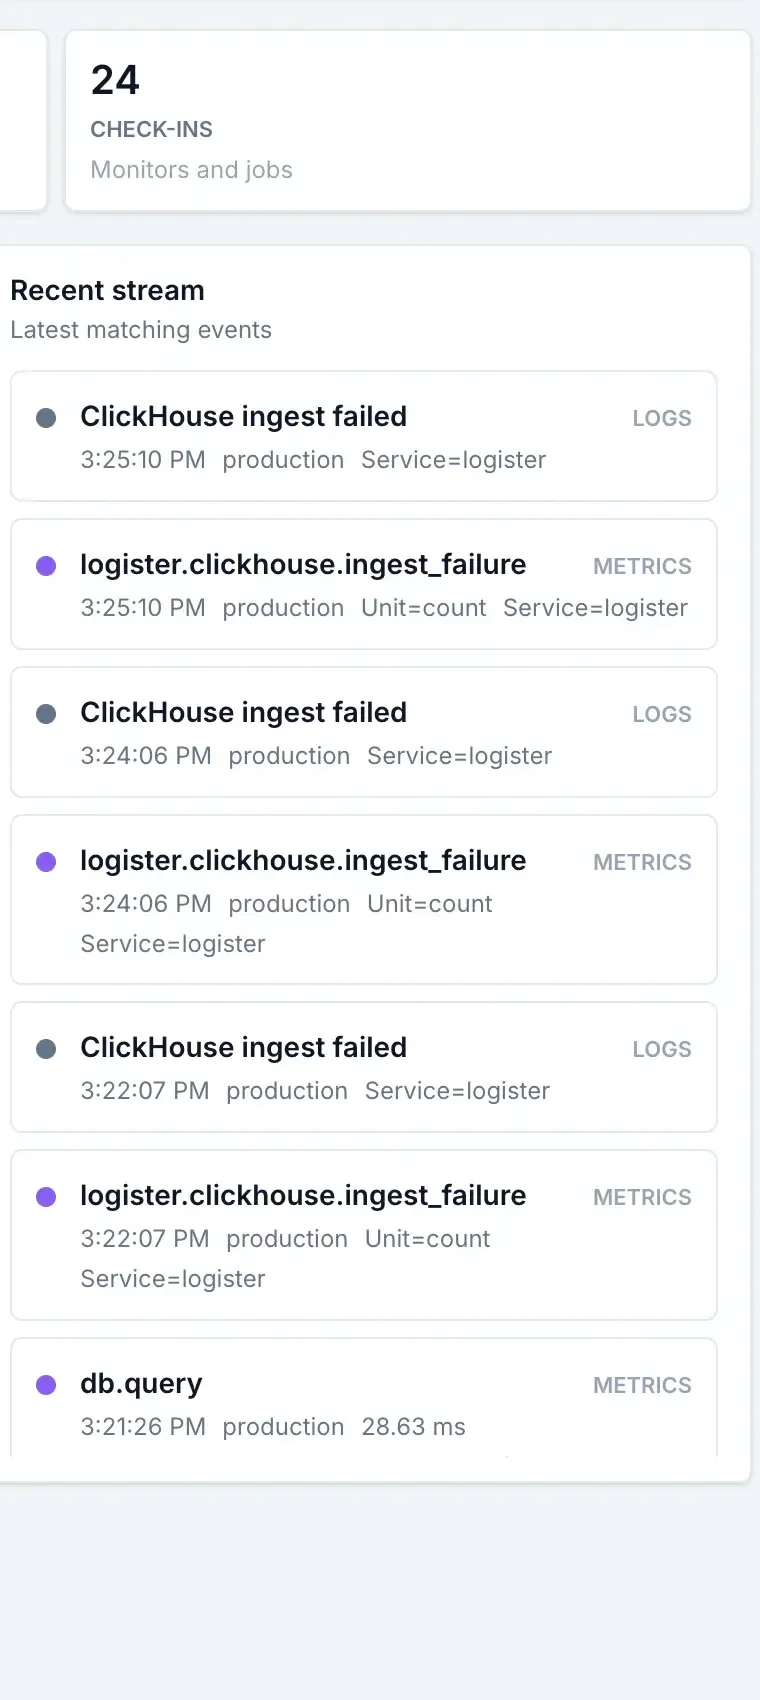
Recent stream
Use the stream after the chart has been narrowed.
- FilterChoose the time, release, environment, and attribute slice first.
- ConfirmCheck that the newest matching events have the labels you expect.
- InspectOpen one row to move from trend-level signal into event detail.
Project lifecycle
Archive projects when you want history, delete only when you mean it.
Project lifecycle controls live in Settings because they change where the project appears in the UI. Archive is the reversible choice: the project leaves active dashboards and menus, but you can still find its history from archived views. Delete is the permanent choice and should only be used when the project and its history should disappear from the product.
| Action | What changes in the UI |
|---|---|
| Archive | The project leaves active lists and dashboards, but remains available from archived project views. |
| Restore | The project returns to active project views so the team can review it like any other app again. |
| Delete | The project is removed instead of being kept for historical review. |
Triage errors
Use the inbox to decide what needs attention.
The inbox shows grouped issues, not every repeated event. Use search when you know the message or fingerprint, the assignee menu when you are dividing work, and the status chips when you want open, introduced-today, resolved, ignored, archived, or all groups. The selected group opens on the right so you can act without leaving the list.
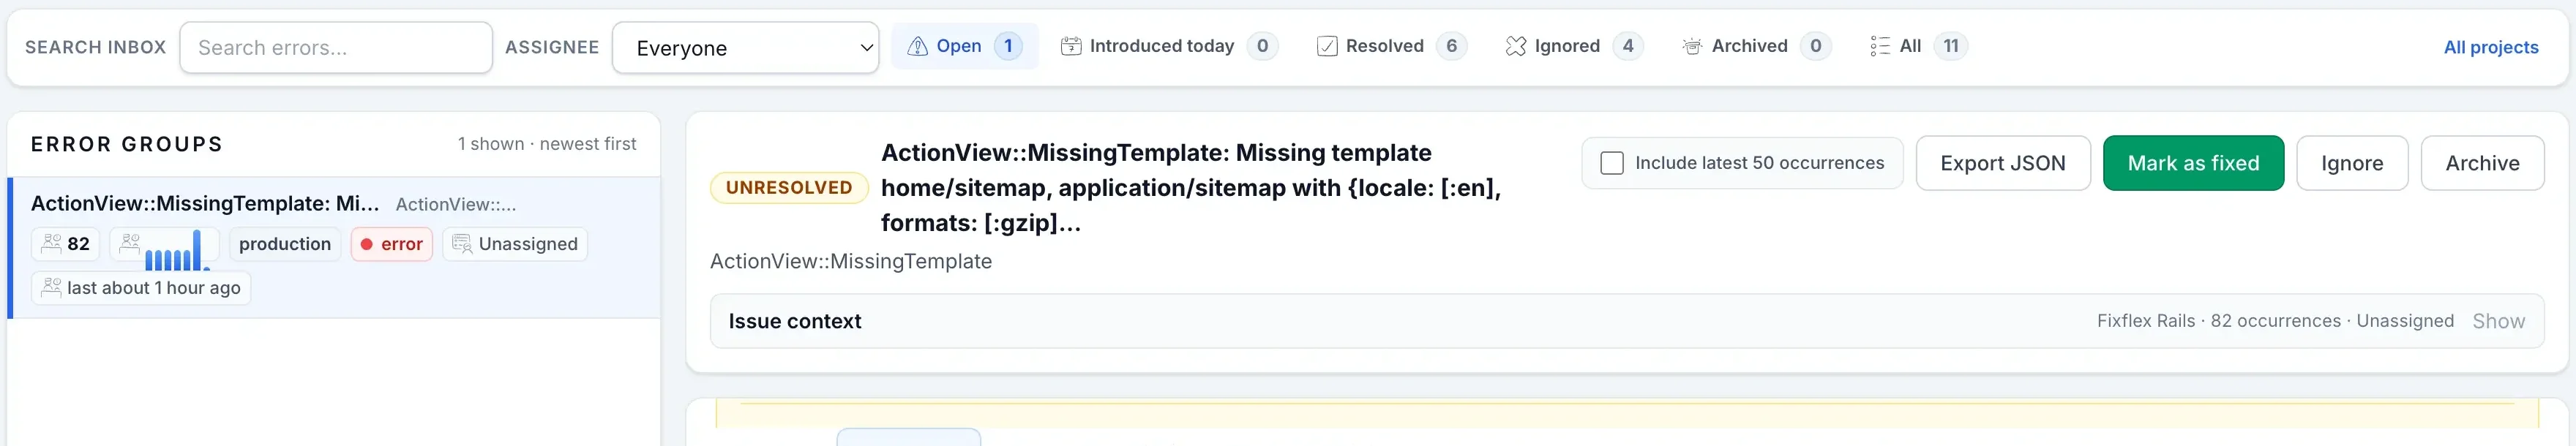
Prioritize
Find the errors that still need review
Use open, introduced-today, and assignee filters to focus on current work instead of already handled issues.
Act
Assign, mark fixed, ignore, archive, or reopen
Move an issue through the triage state that matches your team decision without losing its history.
Catch regressions
See when old problems come back
If a new occurrence arrives for a previously closed issue, Logister reopens it and preserves release context when your events include a release.
Investigate faster
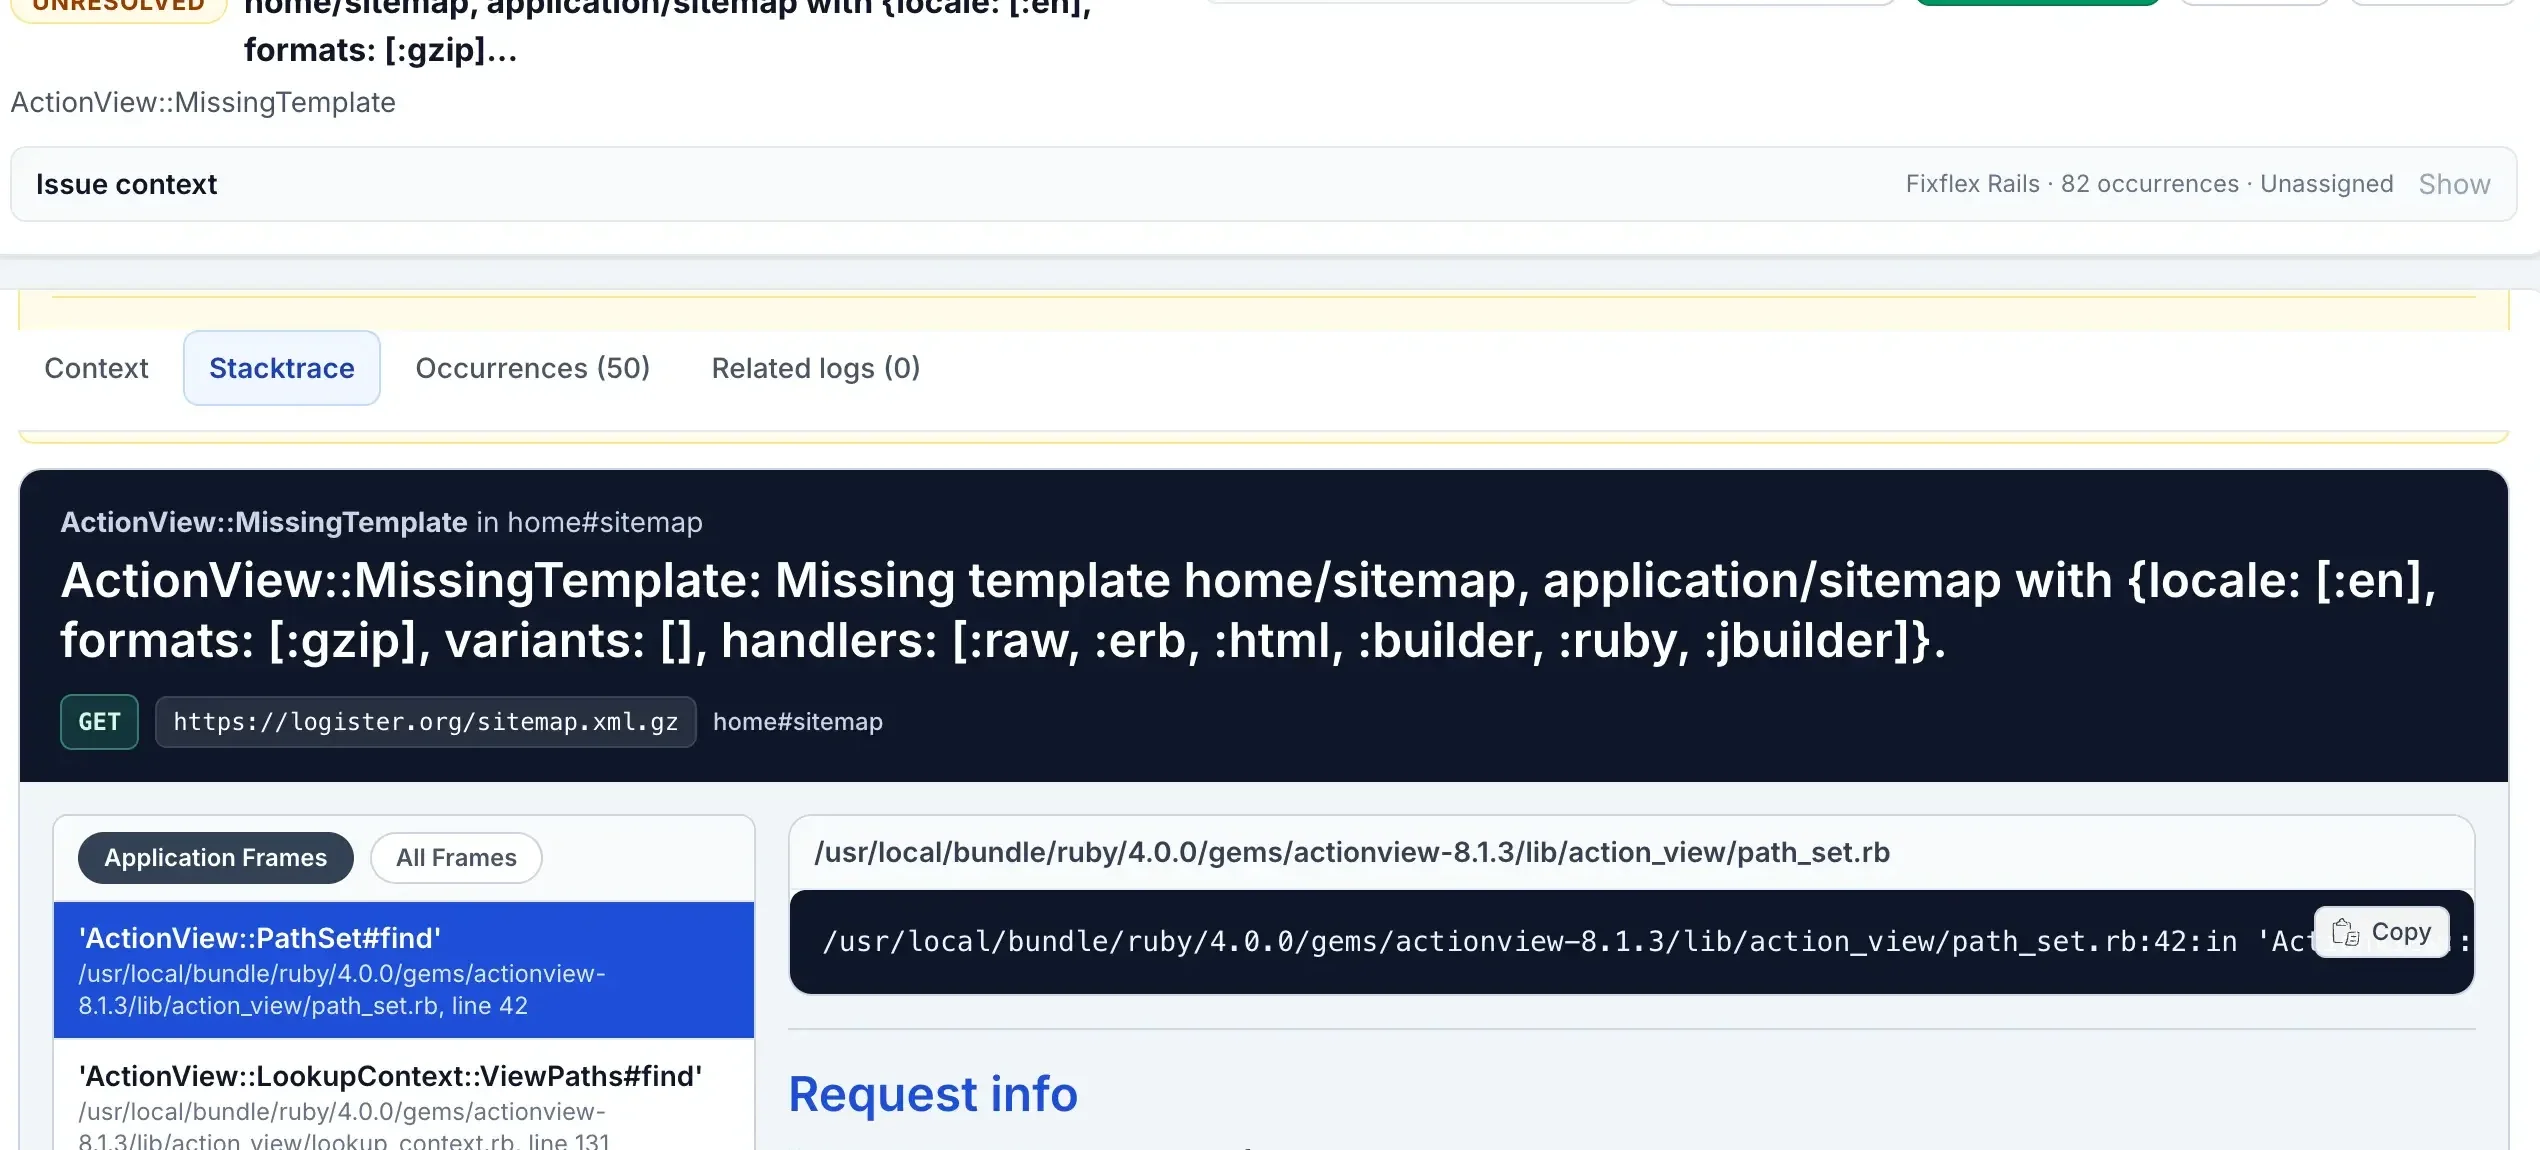
Open an issue and see the context around it.
The event detail pane is designed for the moment after you ask, "what happened here?" It combines payload context, stack or runtime details, occurrence history, and nearby logs that share the same trace, request, session, or user identifiers. Error details keep the main issue content in fixed-height panes so large payloads or long stack traces can scroll without pushing the rest of the workbench away.
| What you need | Where Logister helps |
|---|---|
| Understand the failing request or job | See the HTTP method and URL/path prominently when the integration sends request details, then read environment, release, request identifiers, user identifiers, and custom metadata. |
| Inspect the failure in the language you use | Use runtime-aware views for Ruby, .NET, Python, JavaScript, and CFML so stack traces and log details match the shape of your app. |
| Compare repeats of the same problem | Open the occurrences tab to move between individual events in the same grouped issue. |
| Connect an error to nearby logs | Use related logs to find log records in the correlation window instead of manually searching by request ID. |
If related logs or release context are missing, the event may not include enough shared identifiers yet. Environment and release labels help you compare deploys. Trace, request, session, and user identifiers help Logister connect an error to nearby logs and repeated occurrences.
Understand performance
Turn transactions and metrics into a project performance view.
The project home page gives you a quick read before you open deeper performance views. Use the timeline to see whether activity changed, the inbox summary to see whether errors need review, and the request timing cards to decide whether latency deserves attention.
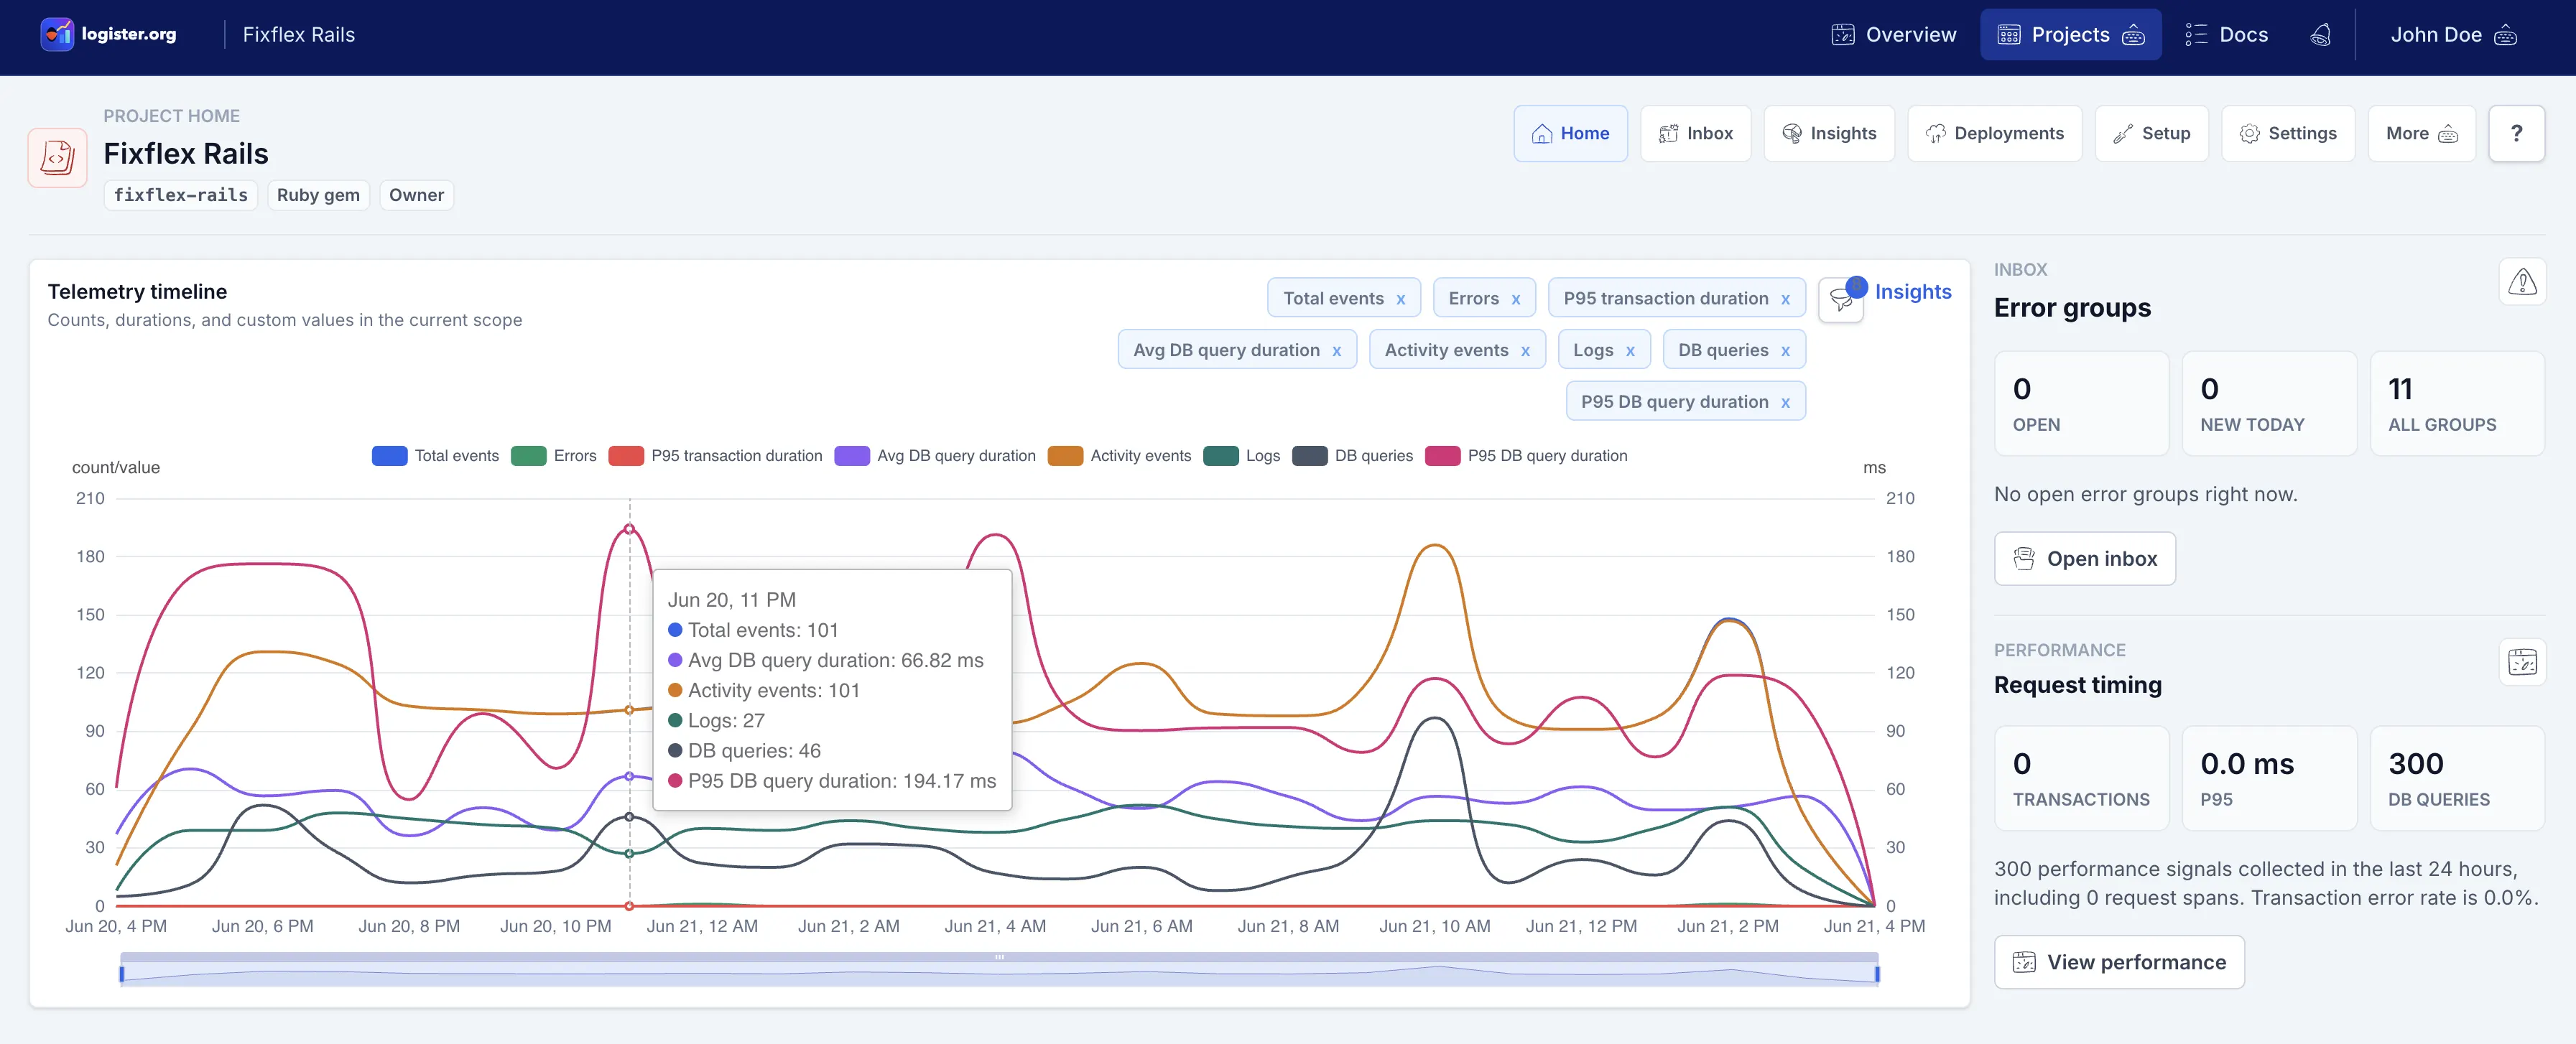
- Transaction cards show volume, throughput, P50 latency, P95 latency, error rate, and Apdex for recent traffic.
- Slow transaction rows highlight the slowest recent work and link to related errors when they share transaction context.
- Database load appears when your app sends database timing metrics such as
db.query. - Release health shows recent releases with total events, error events, introduced issues, and regressed issues when events include release names.
Watch scheduled work
Use check-ins for cron jobs, workers, and recurring tasks.
Scheduled work often fails quietly. Logister check-ins let each job report a slug, status, environment, expected interval, optional release, and duration. The monitor page then shows whether recent jobs are ok, in error, or missed based on the interval you set.
| Check-in status | What it tells you |
|---|---|
ok | The job reported successfully within its expected cadence. |
error | The job reported a failed run. |
missed | The job has not checked in within its expected interval plus grace time. |
Review activity
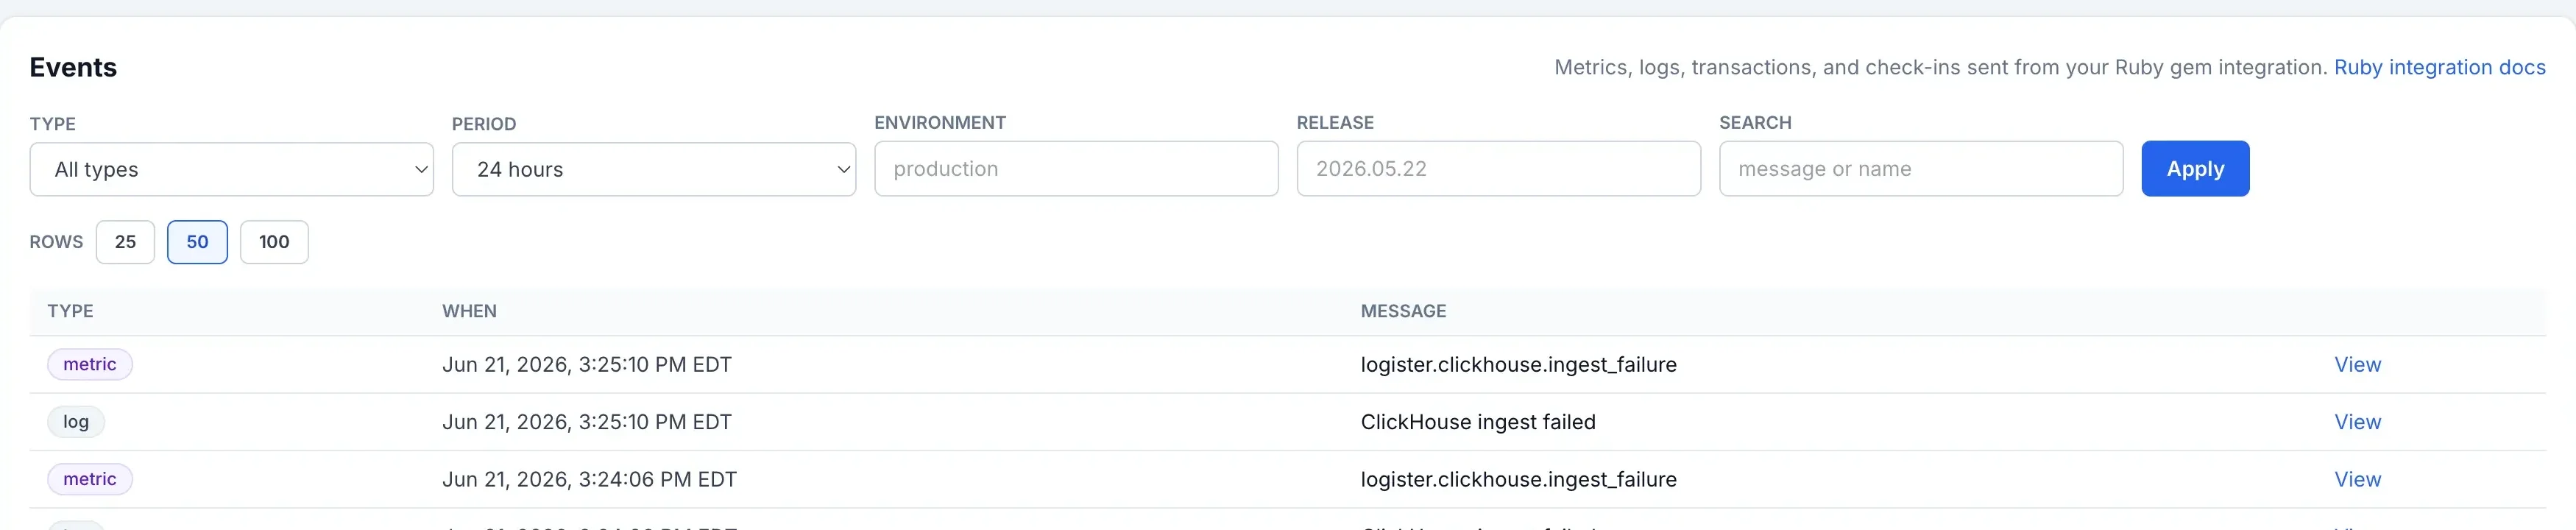
Keep non-error telemetry visible too.
The Events page is the project activity feed. Use the type, period, environment, release, and search filters when you want to confirm that a signal arrived, find a specific log or metric, or open a non-error event with the same detail tools used for errors.
Email notifications
Send useful alerts without turning every occurrence into mail.
Notification settings are split by purpose so users do not have to understand every option at once. Start at Project > Settings > Notifications, choose the path that matches the reason for email, then tune that path only.
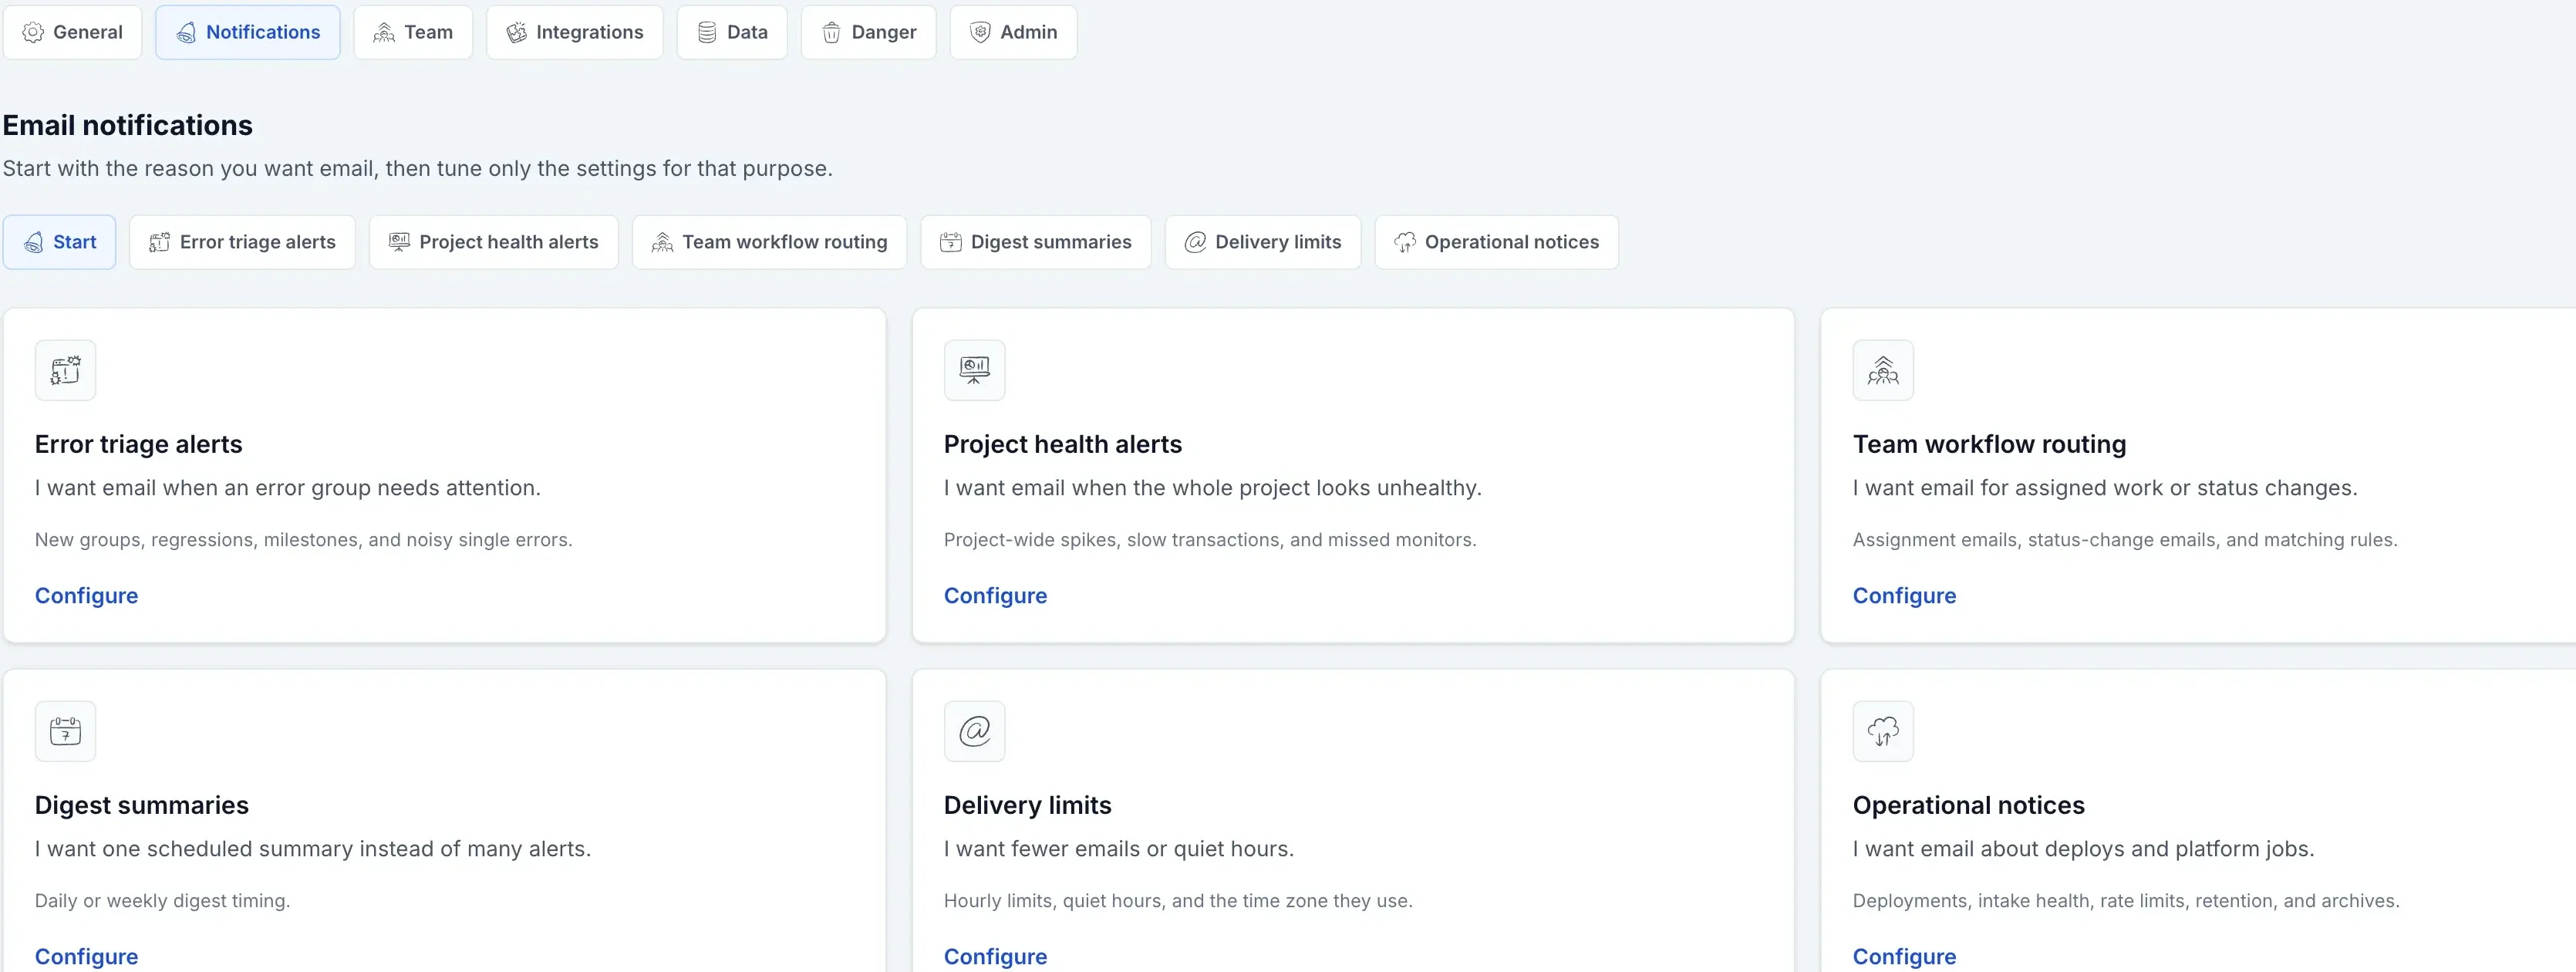
Notifications
Choose a notification path
Error triage, project health, workflow routing, digests, delivery controls, and operational notices each have their own smaller page so users do not have to understand every alert type at once.
Delivery
Know what affects delivery
If email does not arrive, first check whether the user has project access, the matching preference is enabled, and the alert condition actually happened.
Work with teammates
Share project visibility without sharing every account credential.
Project owners can share access with existing Logister users by email. Shared users can open the project, review inbox details, assign and filter issues, inspect activity, performance, monitors, and see the integration guidance. Owners can also see unresolved assignment counts beside members in project settings, while keeping the sensitive controls for API key management, project sharing, project editing, archive and restore actions, and deletion.
Admins can also use the admin area for account-level user cleanup and confirmation work when the instance is configured to grant them access.
Run it yourself
Use product settings for project-level decisions.
Most users only need the project UI: Setup for connecting an app, Inbox for triage, Insights and Events for review, Notifications for email preferences, Team for access, and Data for cleanup choices. Instance-level setup lives in the operations docs so product pages can stay focused on what users see and choose inside Logister.
For project-level cleanup behavior, read the data retention guide. It explains what the Data tab choices mean before you change retention windows or archive settings.
Where to go next
Pick the guide that matches what you are trying to do.
First setup
Create a project and send one event
Metrics
Choose what to collect and report on
Exact payloads
Build against the HTTP API
Self-hosting