Guide overview
Start here if you are setting up Logister for the first time.
This page covers the product-side setup flow after you have a self-hosted Logister instance running, or after you choose the secondary hosted app. Once you have a project and API token, move into the integration guide for Ruby, .NET, Python, JavaScript, Android, iOS, CFML, or Manual / HTTP API depending on what your app runs.
Getting started
Every setup begins with a project.
In Logister, a project represents one monitored app or service. Each project has its own API keys, settings, events, monitors, and integration guidance. If a service is retired later, archive the project to keep its history while removing it from active dashboards and project lists.
Core flow
How data moves into Logister.
- Create a project for the app you want to monitor.
- Generate an API key for that project.
- Send events to
/api/v1/ingest_eventsor check-ins to/api/v1/check_ins. - Review errors, performance data, activity, and monitors in the project pages.
The public ingestion APIs accept 1,200 requests per minute per API token per endpoint by default. Clients that exceed the limit receive 429 Too Many Requests with retry headers. App admins can set project-level overrides when a specific project needs a different limit.
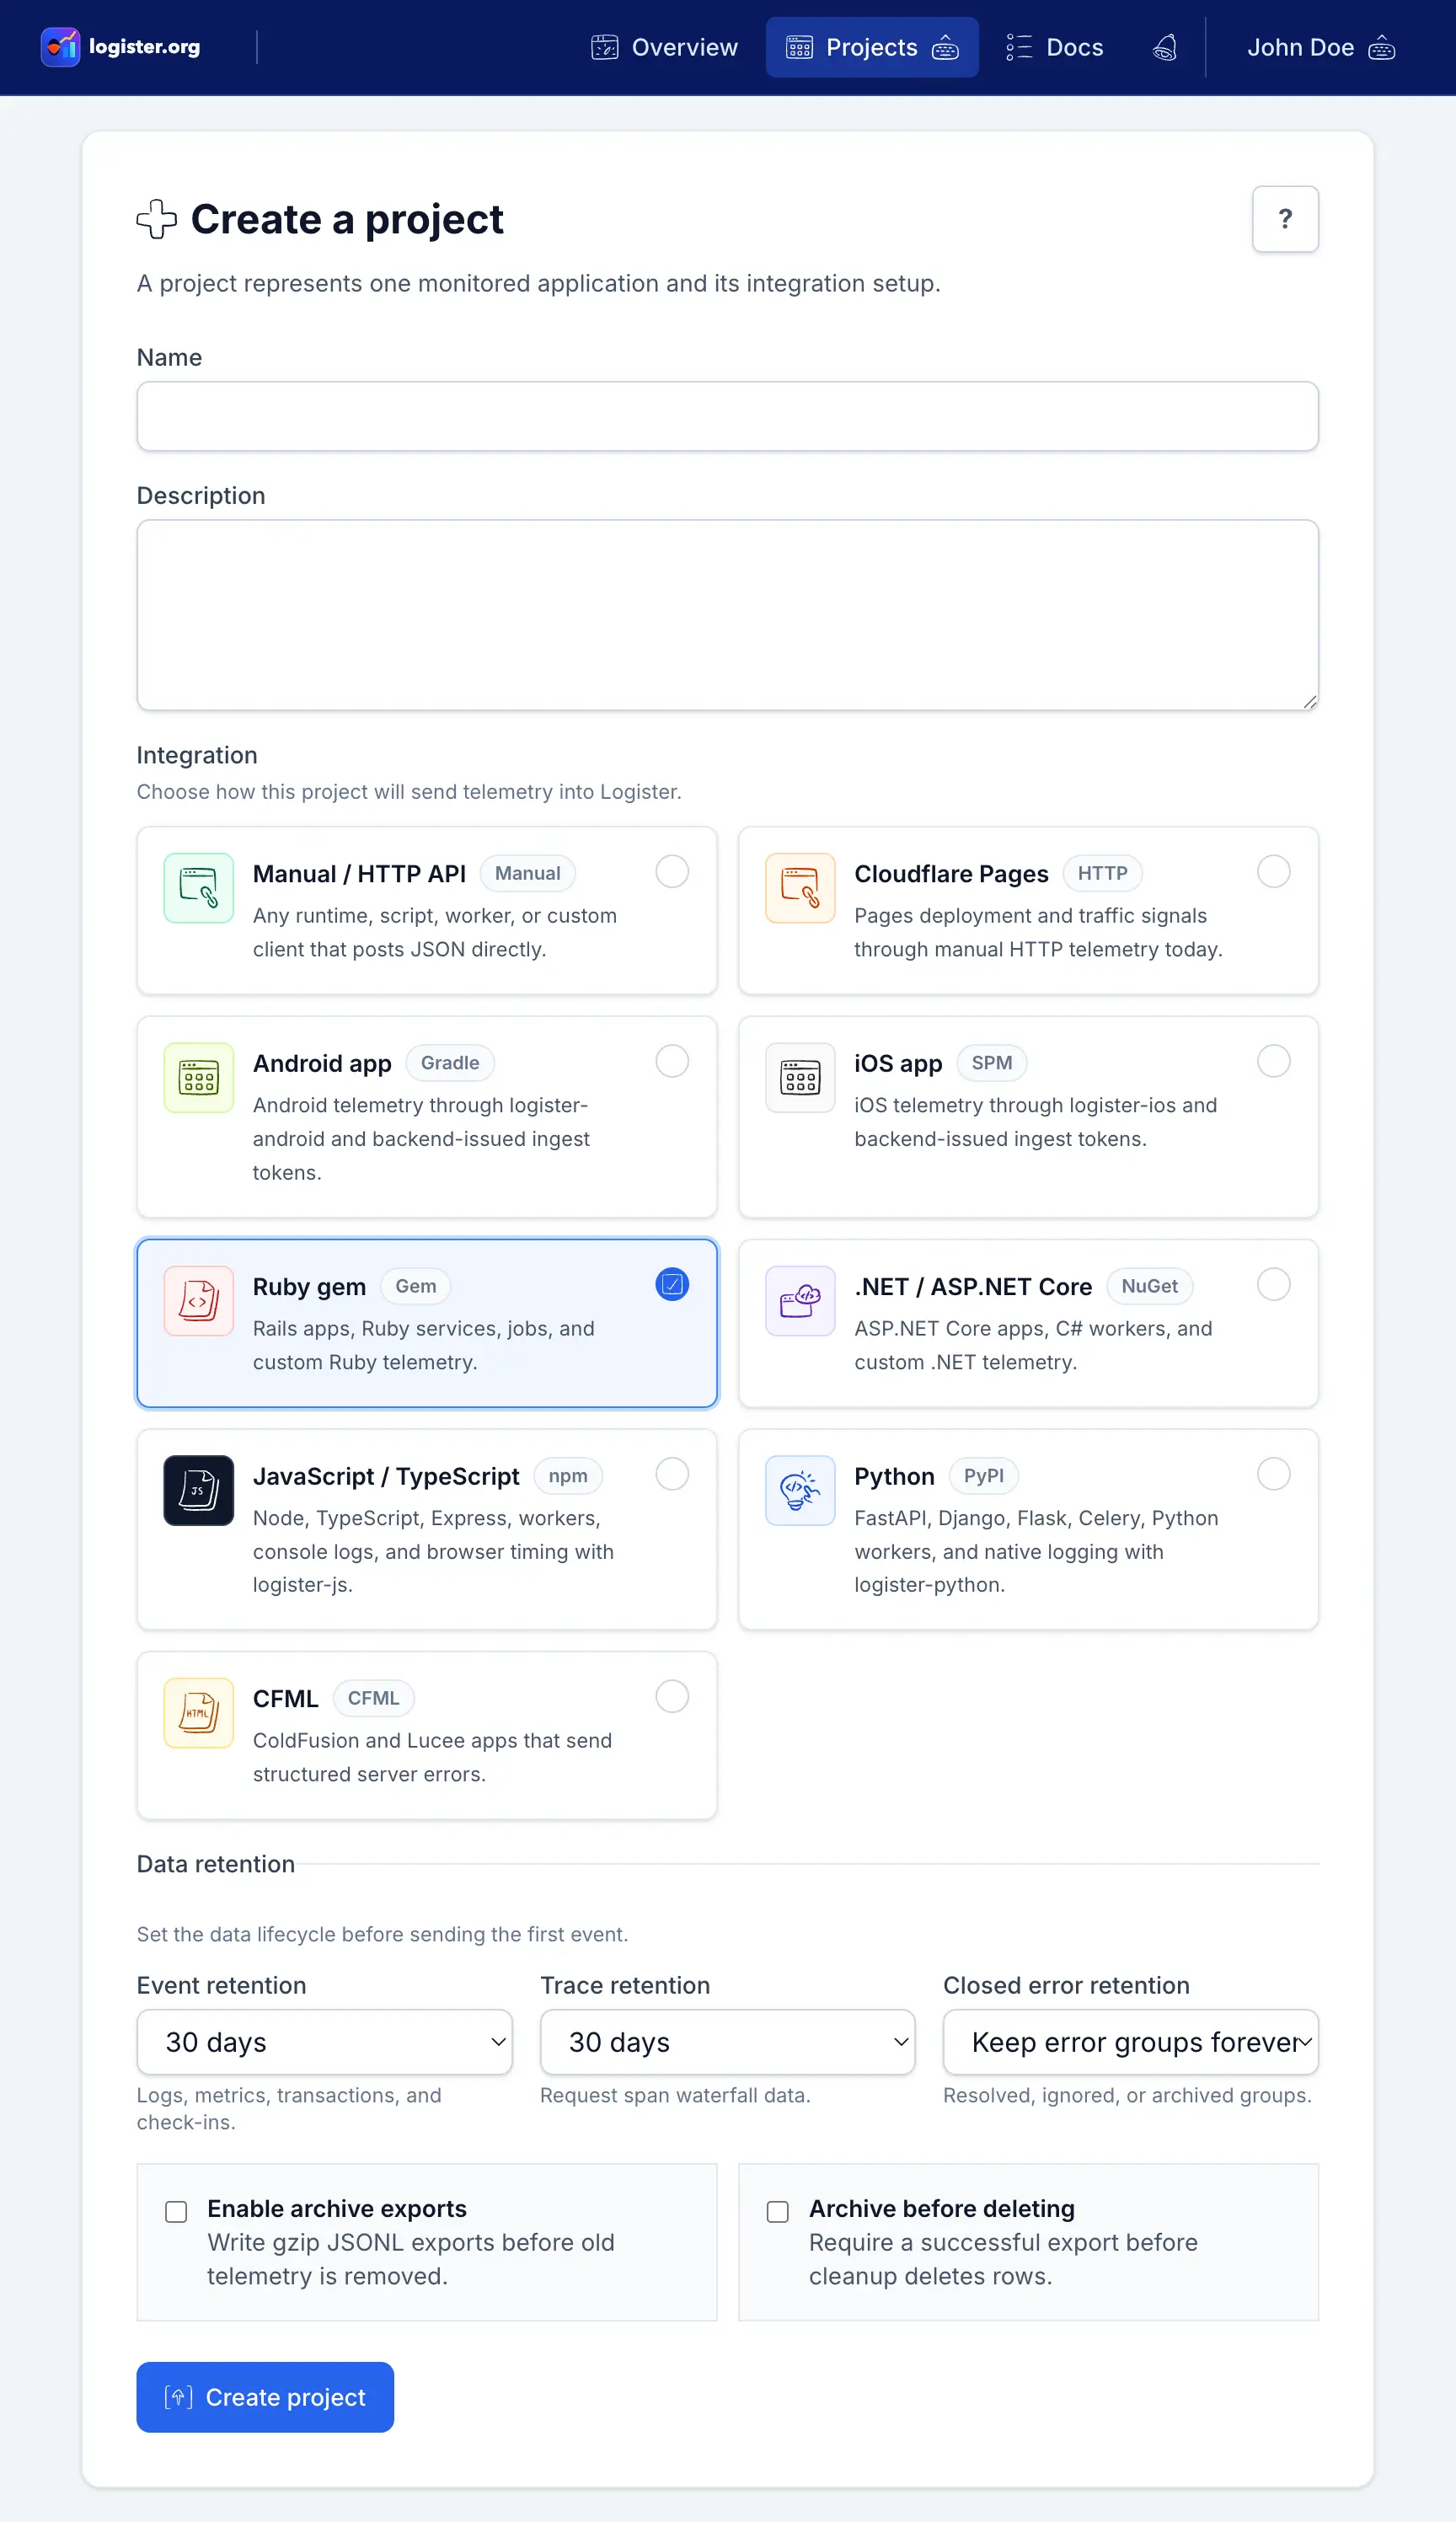
Create a project
Choose the integration type that matches your app.
Create one project per monitored app or service. The new project screen sets the app identity, the integration that will send the first event, and the data retention policy before telemetry starts flowing.
- Use a clear app or service name that teammates will recognize in alerts and dashboards.
- Choose the runtime or Manual / HTTP API path that will send the first event.
- Set retention before the project starts collecting production telemetry.
| Integration type | Best for |
|---|---|
Ruby package |
Ruby apps and Rails services using logister-ruby |
.NET / ASP.NET Core |
.NET 8+ apps, ASP.NET Core services, C# workers, and custom metrics using Logister or Logister.AspNetCore from logister-dotnet |
Python |
FastAPI, Django, Flask, Celery, and Python apps using logister-python, including Python logging capture |
CFML |
Lucee and Adobe ColdFusion apps sending direct HTTP payloads |
JavaScript / TypeScript |
JavaScript and TypeScript apps using logister-js, including optional Express middleware and console capture |
Cloudflare Pages |
Pages sites sending deployment, traffic, or build telemetry through the HTTP API today, with importer settings available for the planned Rails-side Cloudflare fetcher |
Manual / HTTP API |
Unsupported runtimes, one-off scripts, workers, cron tasks, and custom clients that send direct JSON payloads with a project API token |
Generate an API key
Create the token your app will use.
API keys are generated per project from project settings. The token is shown once at creation time, so copy it into your environment or secret manager right away. Archived projects cannot generate new tokens, and archiving a project disables active tokens for that project.
Important
The token is not shown again after creation. Store it before you leave the settings page. If you restore an archived project and want it to send events again, generate a fresh token.
Choose an integration
Move into the guide that matches your app stack.
Ruby
Use the Ruby package
Best if your app is already on Ruby and you want the shortest path to native instrumentation.
.NET
Use the .NET SDK
Best if your app runs on ASP.NET Core or C# services and you want request exceptions, optional request transactions, request spans, metrics, logs, and check-ins.
Python
Use the Python package
Best if your app runs on FastAPI, Django, Flask, Celery, or another Python runtime and you want the logister-python client plus framework helpers and logging support.
JavaScript
Use the npm package
Best if your app runs on Node or another JavaScript or TypeScript runtime and you want the logister-js client, with optional Express middleware and console capture.
Cloudflare Pages
Use direct HTTP telemetry today
Best if the project represents a Pages site and you want deployment, build, or traffic signals in Logister.
Android
Use the Maven package
Best if your app is a Kotlin or Java Android app and you want errors, logs, metrics, transactions, spans, check-ins, release/source context, and safe device metadata.
iOS
Use the Swift package
Best if your app is a Swift iOS app and you want async telemetry methods for errors, logs, metrics, transactions, spans, check-ins, release/source context, and safe device metadata.
CFML
Send direct payloads
Best if your app runs on Lucee or Adobe ColdFusion and sends events over HTTP.
Manual / HTTP API
Send JSON directly
Best if your runtime does not have a first-party add-on yet, or you want cURL, Swagger, or Postman examples before writing a custom client.
Verify setup
Confirm that your project is ready for ingestion.
Project created
Integration type selected
API key generated and copied once
Destination guide chosen
Base URL for your Logister instance confirmed
One test event visible in the project inbox or activity feed
Insights tab shows the event in the summary, timeline, or recent stream
Check-in visible on the monitors page if you are instrumenting scheduled work
Next step
Once those items are done, move into the Ruby, .NET, Python, JavaScript, Android, iOS, CFML, or Manual / HTTP API guide and send one test event first.
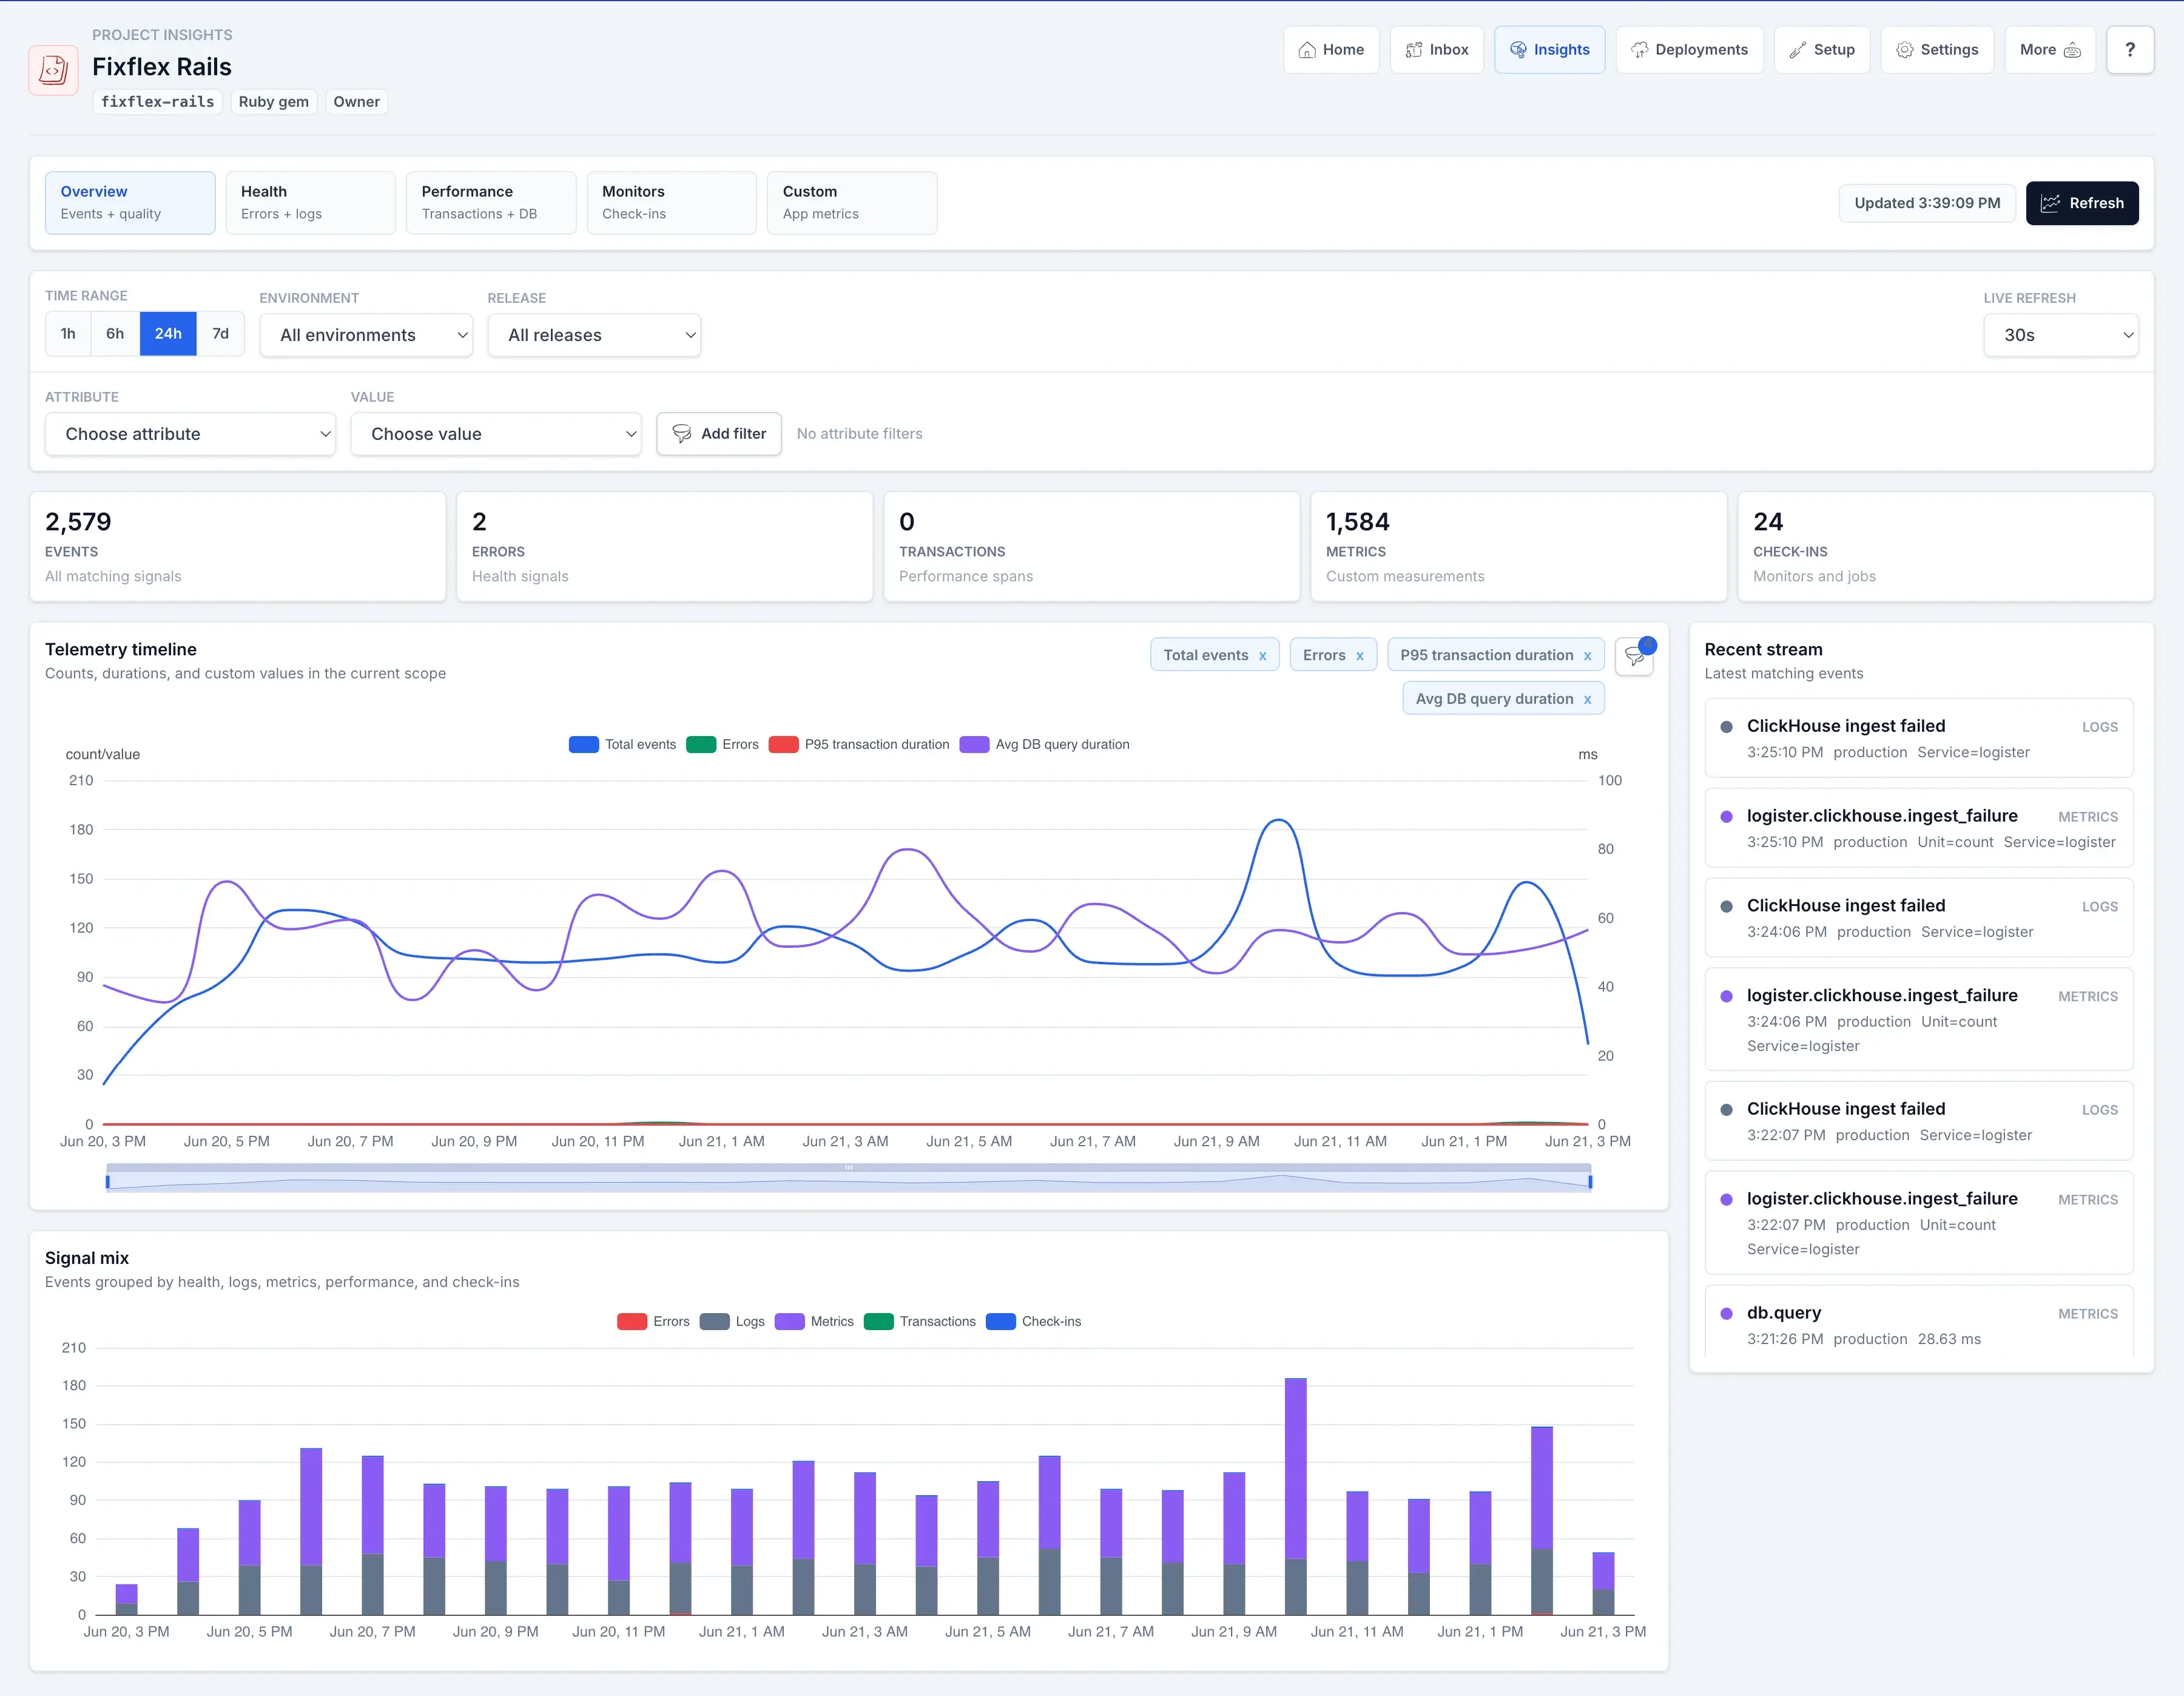
Insights
Open the project Insights tab after your first events arrive.
Insights is the fastest way to confirm what Logister is collecting for a project. Open the project, choose the Insights tab, start with the 24h window, and check whether the summary, event type breakdown, metric catalog, and recent stream match the data you expected to send.
- If the page only shows errors, add logs, metrics, transactions, spans, or check-ins from your integration so the dashboard has more signals to combine.
- If environment or release filters are empty, make sure your client sends consistent
environmentandreleasevalues. - If custom attribute filters are not useful, add stable top-level context keys such as
service,region,queue,route, ortenant_tier. - If custom metric value charts are missing, send numeric metric values in
context.valuewith a stable metric name.
Read the Insights guide for dashboard recipes, or use the metrics reference for supported telemetry, add-on coverage, reporting fields, and data collection boundaries.